
FIRST OF ALL
FINANCIAL MARKETS BUBBLE WARNINGS & BLACK SWANS vs WHITE SWANS
2021 – 2022 Horizon
– FINANCIAL MARKETS BUBBLE WARNINGS & BLACK SWANS vs WHITE SWANS… –
ATA Key Tweets
– ATA Key Tweets… –
Credit Suisse – Back Today on ATA Research Radar
ATA Continuation of…
10.07.2022 – Credit Suisse – Swiss Smart Money Game – Next Lehman Brothers Scenario Risk in Play…
8.10.2022 – Credit Suisse – from Next Lehman Brothers Warning to Lehman Moment Strike and Stop – Finally Rescue Action…
27.11.2022 – Credit Suisse – Record Bank Run Mainstream Panic in Rescue Action Shadow…
11.12.2022 – Credit Suisse – Capital Hike Success in Saudi Shadow…
ATA Following …
Lehman Shadow
15.09.2018 – Financial Decade after Lehman Panic…
JP Morgan
5.06.2022 – JP Morgan – Jamie Dimon “Economic Hurricane” Warning…
Deutsche Bank
and
Nasdaq Bank Index
12.03.2023 – Nasdaq Bank Index – the Sum of All Lehman 2.0 Banks Contagion Fears in Silicon Valley Bank Collapse Shadow…
KBW Bank Index
Lehman Shadow
15.09.2018 – Financial Decade after Lehman Panic…
JP Morgan
5.06.2022 – JP Morgan – Jamie Dimon “Economic Hurricane” Warning…
Emerging Market – Invert EM 2003-2008 Scenario
19.04.2013 – Invert EM 2003-2008 Scenario…
15.04.2015 – Invert EM 2003-2008 ATA Main Scenario – 2-nd Anniversary…
8.07.2015 – Invert EM 2003-2008 ATA Main Scenario RULES…!!!
Polish Stocks
14.11.2015 – POLISH SKYFALL CONTINUUM…
Credit Suisse Master Motives
CS delays annual report after SEC call
Saudi National Bank Pass – No More Rescue Money Aid
$54Bn SNB Liquidity Rescue Plan
CS CDS Higher 1000 even after SNB Rescue Liquidity Plan
CS Stocks Bearish even after SNB Rescue $50B Liquidity Plan
Lehman Brothers 2.0 Lehman Moment still Active vs Lower Level
Master Question What Saudi Investor knows..!!???
Finally for Now
Credit Suisse UBS “Last Banking Temptation” Takeover Deal Time Pressure Rush Hot Weekend…
with Earlier
Rescue Plan – Capital Hike Success
Bank successfully completed the final part of its 4 billion Swiss franc ($4.28 billion) fund raising
Shareholders exercised 98.2% of their subscription rights
Saudi National Bank Rescue Move
Credit Suisse had already raised 1.8 billion francs by placing stock with a group of institutional investors led by Saudi National Bank aking the total funds raised to 4 billion francs
Saudi Crown Prince to Invest in Credit Suisse – WSJ
Mohammed bin Salman is considering $500 Million Injection
Saudi Crown Prince Weighs Investment in CS
Earlier
Credit Suisse Risk OFF Strikes
Mega Loss Forecast 1.6 Billion USD
Record Bank Run – Worst Exodus since Lehman Brothers Financial Crisis
Clients pulled as much as 84 Billion Swiss Francs, or 88.3 Billion US Dollar ,
of their money from the bank during the first few weeks of the quarter
The outflows were especially acute at the key wealth management unit,
where they amounted to 10% of assets under management
vs
CS Rescue Action – RISK ON Motive
Shareholders approved a Capital Raise of about 4 Billion Swiss Francs
that’s needed to finance the restructuring, which will also see about 9,000 jobs cut by 2025
Chairman Axel Lehmann pointed to shareholder approval of the bank planned capital raising
“further positive step in building the new Credit Suisse”
SNB and Fed Swap Line Action
and
Credit Suisse Risk On Verbal Wave and Rescue Action
Credit Suisse pays down Debt to Calm Investors
Credit Suisse offers to buy back own Debt Securities up to CHF3Bn
Pimco, Sixth Street , Centerbridge Restructuring Plan for Credit Suisse
Pimco, Sixth Street and an investor group including Centerbridge Partners
are among a shortlist of bidders for at least part of Credit Suisse Group AG
securitized products business
Citi Credit Suisse Risk On
NOT Lehman Brothers
NOT Lehman Moment
Buy Credit Suisse Recommendation – Target 6 CHF
with
GLOBAL TRENDS
Global Risk OFF Waves Stopped – Bulls Strike Back vs still > June 2022 Lows
Bond Sell Off Wave Stopped
Stocks Sell Off Wave Stopped
Wall Street Risk OFF Wave Stopped – Bulls Strike Back vs still > June 2022 Lows
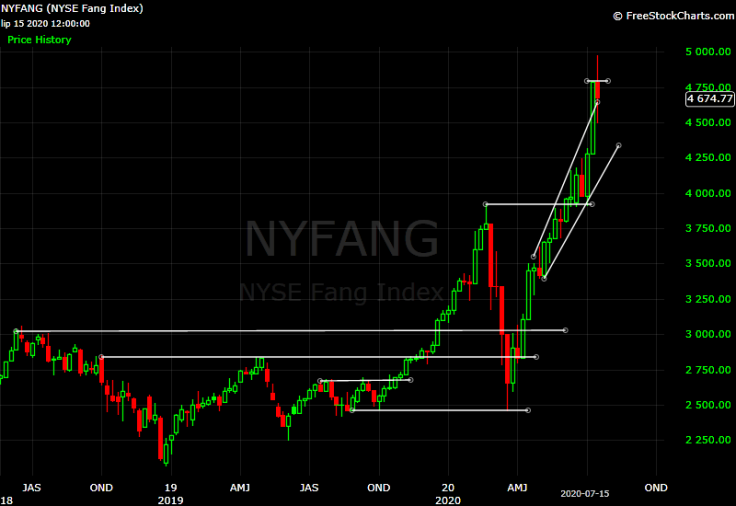
specially US BIG TECH – Nasdaq
Wall Street specially Nasdaq Big Tech RISK ON Reactivation for Now
on
Master Factors
Lehman 2.0 Fear Warning
Next Financial Crisis Mainstream Warns
Fed Hawkish Capitulation Risk
Fed Less Hawkish vs Higher Inflation vs Earlier Powell Disinflation Extreme Euphoria on Wall Street Dust Down
US and Global Recession 2023 Rising Risk vs Soft Landing Rising Lower Probability
Finally for Now
Risks of Fed Pivot Scenario
Fed Less Hawkish Scenario – Pivot – Pause on Horizon
Fed QT – Quantitative Tightening – Fed Balance Sheet Reduction Stopped
and
Fed QT Reactivation Possible Scenario
Investment Conclusion
Wall Street Volatility Active – RISK ON Impulse New Reactivation – Bulls Strike Back – still above September Fib Ret June Lows Zone
with
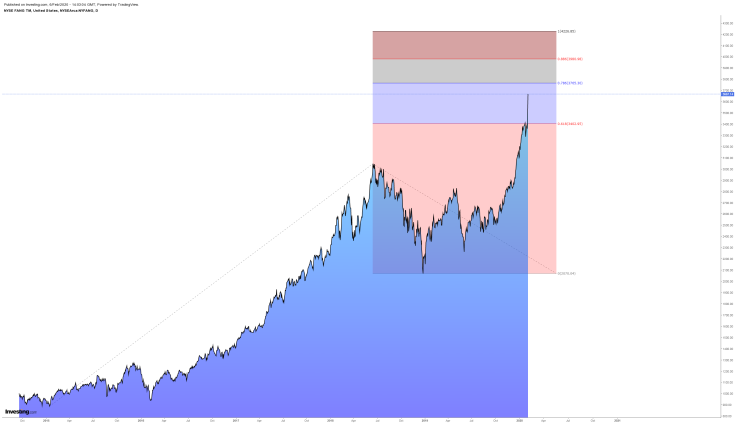
WALL STREET LONG TERM PERSPECTIVE
Tech Boom Cycle – US BIG TECH RUN Stopped – Bulls Strike Back for Now
Nasdaq 100
Bear Hard Wave from November 2021 ATH Top 16.800 Zone Stopped for Now
with
Bulls Strike Back > Lower 12.000 – still > June 2022 Low Key Level 11.000 and 12.000
Fibonacci Constelation
Test – 61.8% Fib Ret 10.500 Zone Bull Wave from 2020 Covid Panic Low
Finally for Now
Bulls Strike Back > 12.000
with
Latest Friday Daily Bull Candlestick
DJIA and S&P500
DJIA
Bear Hard Wave from January 2022 ATH Top 37.000 Zone Stopped for Now
with
Bulls Hard Fight in 33.000 Zone – still > June 2022 Low Key Level 29.500-600
Fibonacci Constelation
Test – 44.7% Fib Ret 28.500 Zone Bull Wave from 2020 Covid Panic Low
Finally for Now
Bulls Hard Fight in 33.000 Zone
vs
Latest Friday Daily Bear Candlestick
S&P500
Bear Hard Wave from January 2022 ATH Top 4.800 Zone Stopped for Now
with
Bull Strike Back > Psychological Key Level 3.900 – non stop above June 2022 Low Key Level 3.600
Fibonacci Constelation
Test 50% Fib Ret 3.500 Zone Bull Wave from 2020 Covid Panic Low
Finally for Now
Bill Strike Back > Key Level 3.900
with
Latest Friday Daily Bulls Spinning Top Candlestick
CENTRAL MOTIVE Fed vs ECB SNB BoJ and PBoC
Fed
Fed Dynamic QT Reduction
Fed Capitulation Risk
Fed Hawkish – Fed Pause on Horizon or Dovish Pivot Scenario
February 25pbs Rate Hike
Fed Fund Futures Hawkish Target 5% or even Higher 6%
March – Next Rate Hike 25bps – 62% Probability
ECB
ECB still more Hawkish vs ECB Less Hawkish and Dovish Pivot on Horizon
March – Rate Hike 50bps
February 50pbs Rate Hike
ECB Eurozone Danger Dilemma
Lagarde Hawkish vs Recession Stagflation Fragmentation Bond Yield Risk
ECB vs Russia-Ukraine War
Energy Crisis
Italy Debt – Yield and Political Crisis
SNB
SNB More Hawkish – No SNB Dovish Pivot
March – Next Rate Hike 50bps
BOJ
non stop Ultra Dovish afer January 2023 BoJ Meeting
vs
Japan CPI inflation 42 Year High +4.3% Y/Y – BoJ Hawkish
BoJ New Governor Kazuo Ueda – Hawkish Risk on Horizon
with
BoJ FX Interventions – September and October
Japan Mega QE
Japan QE > European QE > US QE
PBoC
PBoC – People Bank of China – still Dovish
Last
Cut Banks Reserve Ratio by 25bps
earlier
PBoC Cuts Rates Wave 2022
USD FX MASTER TRIGGER
( DXY Futures )
Dollar Index
Bull Long Term Wave Hard Stopped
Bulls Last Wave Stopped – Bears Strike Continuation for Now
USD/JPY Bearish Wave still Active for Now – Bears Strike cont.
still > 130 vs back < 133 from Higher 138 Zone
after Earlier Hard Fall < Psychological Key Level 150 after BoJ FX Intervention
US Dollar Index
Earlier Bullish Acceleration New Higher 20 Years High 115 Zone ( stricte 114.778 )
Long Term Bulls FX Wave Hard Stopped for Now
2022
September Bullish Monthly Candlestick – Large Real Body vs Long Upper Shadow
October Bearish Doji Monthly Candlestick – Volatility and Long Upper Lower Shadows
November Bearish Monthly Candlestick – Large Real Body
December Bearish Monthly Candlestick
2023
January Bearish Monthly Candlestick Long Upper Shadow vs Short Lower Shadow
February Bullish Monthly Candlestick – Large Real Body Lower Shadow
March Bearish Monthly Candlestick – Small Real Body
( needed confirmation – EOM )
with
First
Bearish Pattern 2B Activated – Key Level 114.50
Short Term Bear FX Strike from 115 Zone to 109.50
Test Key Level 109 110 Zone – 68.5 -78.6%
and
Bears Strike Back from 113 Zone under Key Level 109.50
Break Down July/22 Top 109.30
Bear New Strike to Lower 101 under Fib Ext 101.50 Zone
vs
Last
Bear Trap Activation
Bull New Dynamic Strike Back above Fib Ext 101.50
and above Fib Ret 102
Bull still > 104
vs
Latest Bull Trap Activation – Key Level 105
Bear New Dynamic Strike cont. < 104
Now still
ABOVE 99 – 100 Zone – Key Level Zone Covid 2020 Year Top
and
ABOVE 102 Key Level Zone European Debt Crisis 2016 Year Top
ATA Conclusion
Dollar Index Long Term Bull Wave Stopped for Now vs still Active Bear Wave Stopped in 101 – 10.50 – 102 Zone
with
Last Bullish New FX short term Move from 101 back above Fib Ext 101.50 and Fib Ret 102
vs
Latest Bear New Dynamic Strike cont. < 104
DXY BattleField
Key Levels 103 103.30 104.50 103.80 vs 104 104.50 104.80 105
Zone in Smart Money FX Game
special focus on
Present Key Levels 103 103.30 104.50 103.80 vs 104 104.50 104.80 105
( EOW 103.83 )
First of All…ATA from 15.09.2018
– Financial Decade after Lehman Panic… –
” ATA Strategic Conclusion
NEXT CRISIS
will be
GLOBAL DEBT ARMAGEDDON…!!! ”
ATA from 11.12.2022
“Credit Suisse Battlefield
3.00 3.30 vs 3.50 4.00 4.30-35 4.50 5.00 USD
ATA Investment Conclusion
Capital Hike Success – Restructuring Plan Action – NOT Lehman Moment for Now
Master Question – FOR HOW LONG…!!???
ATA Master Answer – Psychological Key Level 3 USD Test Result …!!!
after Last
Bank Run Lehman Moment Fear
special focus on
Present Active Key Levels Zone‘
3.00 3.30 vs 3.50 4.00 4.30-35 4.50 5.00 USD ”
ATA Credit Suisse Last Key Tweets
Second…Present Credit Suisse Situation
CREDIT SUISSE LONG TERM SITUATION
ATA MARKET MODEL IN LONG TERM ACTION
First of All
Credit Suisse
Wall Street
All Time High – April 2007
80 USD Zone ( stricte 79.29 USD )
Fresh All Time Low – March 2023
1.80 USD Zone ( stricte 1.78 USD )
Quarterly View
Activated
Quarterly Bearish Reversal Candlestick Pattern Shooting Star ( Q2/2007 )
70-80 USD Zone
Quarterly Bearish Reversal Pattern 2B – Key Level 57 USD
Q3 September 2000 – Q1 March 2008
Bear Trend
Secular Bear Trend Channel since 2007 Year Top
Lower Edge Key Level 3.50 USD
Upper Edge Key Level 5.00 USD
Break Down Lower Edge Secular Bear Trend Channel
still No Permanent Back inside Secular Bear Trend Channel
Now dominating
Waterfall Pattern
Bear Dynamic Wave
vs
Bull Strike Back and Bull Hard Fight
Psychological Key Level 2 USD Zone
on
SNB Rescue Plan and UBS Takeover Talks
Quarterly Q1/23 Bear Candlestick – Large Real Body
( confirmation needed – EOQ )
Mega Volume Q1/23
Quarterly MACD Sell Signal
Monthly View
Activated
Monthly Bearish Patterns
Ending Diagonal – Break Lower Edge – Key Level 64 USD – July 2007
2B – Key Level 59 USD – November 2007
H&S Hybrid Pattern – Break Neckline 52 USD – January 2008 ( Line Chart )
Bear Trend
Secular Bear Trend Channel since 2007 Year Top
Lower Edge Key Level 4.25 USD ( Candlestick – Line Charts )
Upper Edge Key Level 8 USD Zone
still outside Secular Bear Trend Channel
still under Lower Edge Key Level 4.25USD ( Candlestick Chart )
Now dominating
Bear Hard Wave
vs
Bull Dynamic Strike Back from Fresh March/23 ATL 1.80 USD Zone
Bull Fight in Psychological Key Level 2 USD Zone
outside
Inverted Ending Diagonal
Lower Edge – Key Level 2.20 USD
Monthly March Bear Candlestick – Lower Shadow
( confirmation needed – EOM )
Monthly MACD Sell Signal
Weekly Daily View
After Breakdown Psychological Key Level 3 USD
and
Panic Sell Off Wave to 1.80 USD Zone
vs
Latest
Bullish Dynamic Correction back to Psychological Key Level 2.00 USD
Now dominating
Bull Hard Fight in Psychological Key Level 2.00 USD
outside
Inverted Ending Diagonals
Weekly
Lower Edge – Key Level 2.20 USD Zone
Daily
Lower Edge – Key Level 2.10 USD Zone
Latest Candlesticks
Bear Weekly Candlestick– Long Lower Shadow
Bear Daily Candlestick
MACD Weekly Sell Signal New Activated
MACD Daily Sell Signal
Credit Suisse Battlefield
1.80 2.00 vs 2.20-30 2.50 3.00 USD
ATA Investment Conclusion
SNB Rescue Plan and UBS Takeover Talks Action – Lehman Moment Stopped for Now
Master Question – What is on the Negotiation Tabel …!!???
ATA Master Answer – Psychological Key Level 2 USD Test Result …!!!
special focus on
Present Active Key Levels Zone‘
1.80 2.00 vs 2.20-30 2.50 3.00 USD
and
Research Classic and Candlestick Patterns Confirm or Cancel
of course with
New
Credit Suisse News
SNB UBS and ECB Fed Verbal Strikes and Verdicts
Swiss Eurozone Stocks and Wall Street Strikes
Swiss Eurozone and Global Macro Economy News
Governments & Central Banks Strikes
Russia Moves Ukraine War – China – Taiwan
War and Global Economy News
and of course
Future Final Smart Money Reaction…
First…EOM – March
Finally…EOQ – Q1 – March
Credit Suisse Quarterly Monthly and Weekly Charts
8.07.2022 – EOW


Credit Suisse Daily Charts Intraday Swiss SIX CHF
4 – 6 – 7 .10.2022


Credit Suisse Quarterly Monthly Weekly and Daily Charts
7.10.2022 -EOW


Credit Suisse Quarterly Monthly Weekly Daily Charts
25.11.2022 – EOW


9.12.2022 – EOW


17.03.2023 – EOW