

FIRST OF ALL
FINANCIAL MARKETS BUBBLE WARNINGS & BLACK SWANS vs WHITE SWANS
2021 – 2023 Horizon
– FINANCIAL MARKETS BUBBLE WARNINGS & BLACK SWANS vs WHITE SWANS… –
SPDR Gold Shares – Back Today on ATA Research Radar
GLD is one of the most popular ETFs in the world, offering gold exposure
based on physically-backed gold bullion
ATA Continuation of…
2021
21.08.2021 – SPDR Gold Shares – Golden Equilibrium in Palantir Bet Flash…
ATA Following …
Newmont Goldcorp
13.11.2022 – Newmont Goldcorp – Gold Spark in US Dollar Dark – Smart Money Golden Fibonacci Move…
Barrick Gold
6.11.2022 – Barrick Gold – Gold Spark in US Dollar Dark – Fibonacci Smart Money Golden Action…
GOLDEN SPECTRUM
7.04.2020 – GOLD – GOLDEN SECULAR SPECTRUM …
GOLD Futures
24.07.2022 – GOLD Futures – Golden Bulls Bears 10 Years War – Major Bullish Zone under Bearish Attack in USD FX Shadow…
GOLD Spot
Global X Silver Miners ETF
16.08.2021 – Global X Silver Miners ETF – Silveren Tactic Wave…
XAU/XAG – Gold/Silver Ratio
27.07.2020 – XAU/XAG – BEARS DEALING CARDS…
Gold/Bitcoin Ratio
19.06.2022 – GOLD/BITCOIN RATIO – from Golden Bullish Reversal to Bulls Wave…
Copper/Gold Ratio
18.06.2022 – COPPER/GOLD RATIO – from Bearish Reversal to Bear Wave in Stagflation Fear Mainstream Flashes…
SILVER Spot
20.11.2022 – SILVER Spot – New Hard Climb in US Dollar and Fed Shadows…
iShares Silver Trust
4.12.2022 – iShares Silver Trust – Silver Bull Action on USD and Fed RISK ON Double Impact…
Global X Silver Miners ETF
16.08.2021 – Global X Silver Miners ETF – Silveren Tactic Wave…
SPDR Gold Shares Key Motives
SPDR Gold Shares tracking GOLD Spot
Gold anti USD Path
Gold Spot Bull Dynamic Strike Back Cont. above
1st Psychological Key Level 1800 USD
2nd Higher Psychological Key Level 1900 USD
on
Yellen Warning Global Financial Crisis – US Debt Limit Ceiling Risk
in
GLOBAL DOLLAR – DXY F/X Bearish Shadow
with
GLOBAL TRENDS
Global Risk On Waves New Reactivation – Bulls Bears Hard Fight – Latest Bulls Dynamic Strike > June 2022 Lows
Bond Sell Off Wave Stopped
Stocks Sell Off Wave Stopped
Wall Street Risk ON Wave New Reactivation – Bulls Strike Back > June 2022 Lows
specially US BIG TECH – Nasdaq
Wall Street specially Nasdaq Big Tech RISK ON Action for Now
on
Master Factors
US Big Tech Layoff Wave – Costs Reduction
US and Global Recession 2023 still Active Rising Risk
Finally for Now
Fed Less vs still Hawkish Scenario but with Pivot on Horizon – Target 5% Zone
with
Fed – QT – Quantitative Tightening – Fed Balance Sheet Reduction
US Earnings Stagflation Recession Fear with Ukraine War RISK OFF Impact
on
US Inflation Peak and Disinflation Wave Mainstream Scenario
Investment Conclusion
Wall Street Volatility Active – RISK ON Impulse New Reactivation – Bulls Strike Back above September Fib Ret June Lows Zone
with
LONG TERM MOTIVES
WALL STREET
Tech Boom Cycle – US BIG TECH RUN Stopped – Bulls New Strike Back
Nasdaq 100
Bear Hard Wave from November 2021 ATH Top 16.800 Zone Stopped for Now
Bulls New Strike Back > June 2022 Low Key Level 11.000 and Higher 11.500 – non stop above Lower 10.500
Fibonacci Constelation
Test – 61.8% Fib Ret 10.500 Zone Bull Wave from 2020 Covid Panic Low
Finally for Now
Bulls Strike Back > Higher 11.500
with
Latest Friday Daily Bull Candlestick
DJIA and S&P500
DJIA
Bear Hard Wave from January 2022 ATH Top 37.000 Zone Stopped for Now
Bulls Strike Back from Lower Key Level 33.000 – still > June 2022 Low Key Level 29.500-600 and Lower 28.500 Zone
Fibonacci Constelation
Test – 44.7% Fib Ret 28.500 Zone Bull Wave from 2020 Covid Panic Low
Finally for Now
Bull Strike Back from Lower 33.000
with
Latest Friday Daily Bull Candlestick
S&P500
Bear Hard Wave from January 2022 ATH Top 4.800 Zone Stopped for Now
Bulls Strike Back from Lower Key Level 3.900 – non stop above June 2022 Low Key Level 3.600 and Lower 3.500 Zone
Fibonacci Constelation
Test 50% Fib Ret 3.500 Zone Bull Wave from 2020 Covid Panic Low
Finally for Now
Bulls Strike Back from Lower 3.900
with
Latest Friday Daily Bull Candlestick
CENTRAL MOTIVE Fed vs ECB SNB BoJ and PBoC
Fed
Fed Less Slower Hawkish vs still Hawkish vs Fed Dovish Pivot on Horizon
February 25pbs Rate Hike Outlook
after
December 50bps Rate Hike
November 75bps Rate Hike
ECB
ECB still Hawkish – No ECB Dovish Pivot
February 50pbs Rate Hike Outlook
Lagarde more Hawkish New Speech – ‘stay the course’ in monetary policy
after
December 50bps Rate Hike
ECB Super Hawkish Verdict – 75bps Rate Hike October
ECB Eurozone Danger Dilemma
Lagarde Hawkish vs Recession Stagflation Fragmentation Bond Yield Risk
ECB vs Russia-Ukraine War
Energy Crisis
Italy Debt – Yield and Political Crisis
SNB
SNB less Hawkish vs still Hawkish – No SNB Dovish Pivot
after
December 50bps Rate Hike
Swiss Central Hawkish Wave 2022
BOJ
non stop Ultra Dovish afer January 2023 BoJ Meeting
with
BoJ FX Interventions – September and October
Japan Mega QE
Japan QE > European QE > US QE
PBoC
PBoC – People Bank of China – still Dovish
after
PBoC Cuts Rates Wave 2022
USD FX MASTER TRIGGER
( DXY Futures )
Dollar Index
Bull Long Term Wave still Stopped vs Bear Wave Stopped in 102 Zone – Bulls Bears Hard FX Fight for Now
USD/JPY Bearish Wave Stopped for Now – Bulls New Strike Back from Fibonacci Ret 50% 127.30
Back > 129 vs still < 130
after Earlier Hard Fall < Psychological Key Level 150 after BoJ FX Intervention
US Dollar Index
Earlier Acceleration New Higher 20 Years High 115 Zone ( stricte 114.778 )
Long Term Bulls FX Wave Stopped
2022
September Bullish Monthly Candlestick – Large Real Body vs Long Upper Shadow
October Bearish Doji Monthly Candlestick – Volatility and Long Upper Lower Shadows
November Bearish Monthly Candlestick – Large Real Body
December Bearish Monthly Candlestick
2023
January Bearish Monthly Candlestick in Play
Long Upper Shadow vs Short Lower Shadow for Now
( needed confirmation – EOM )
with
First
Bearish Pattern 2B Activated – Key Level 114.50
Short Term Bear FX Strike from 115 Zone to 109.50
Test Key Level 109 110 Zone – 68.5 -78.6%
Last
Bears Strike Back from 113 Zone under Key Level 109.50
Break Down July/22 Top 109.30
Latest
Bear New Strike to Lower Fib Ext 101.50 Zone
vs
Bull New Dynamic Strike Back from Fib Ext 101.50 to Fib Ret 102
with
Bulls vs Bear FX Hard Fight in 102 Zone
Now
ABOVE 99 – 100 Zone – Key Level Zone Covid 2020 Year Top
and
IN 102 Key Level Zone European Debt Crisis 2016 Year Top
ATA Conclusion
Dollar Index Long Term Bull Wave Hard Stopped vs Bear Wave Stopped in 102 Zone –
with
Last Bullish FX short term Move from Fib Ext 101.50 to Fib Ret 102
Latest Bulls Bears Hard FX Fighting in 102 Zone
DXY BattleField
Key Levels 101.50 102 vs 102.30 102.50 102.80 103 Zone in Smart Money FX Game
special focus on
Present Key Levels 101.50 102 vs 102.30 102.50 102.80 103
( EOW 101.99 )
First…ATA from 21.08.2021
” Present
Long Term Consolidation in Lower Zone 155 – 160 USD
March 2021 – August 2021
Open Option
Bull Reversal Pattern – W ”
ATA Yellen BlackRock Dr Doom BIS Big Short Warning
Gold Silver US Inflation DXY Fed BoJ ECB Central Banks Key Tweets
Yellen Warning
BlackRock Warning
Dr Doom Nouriel Roubini Warning
BIS Warning
Big Short Michael Burry Warning
Real Estate Blackstone Warning
Warnings – Gold Safe Haven
Derivatives Disaster Warning
Financial Mainstream Game True Explanation…
GOLD
DXY – FX Master ANTI Gold & Silver Factor
EUR/USD – FX Major PRO Gold & Silver Factor
US Government Debt Economy Black Swan
Fed Black Swan
BoJ – Black Swan
ECB – Black Swan
SNB – Black Swan
Central Banks – Black Swans
Fed SNB Emergency Swap Action – Extreme Low Global Liquidity Risk
Second. SPDR Gold Shares Present Situation
GLD LONG TERM SITUATION
ATA MARKET MODEL IN LONG TERM ACTION
Monthly View
First of All
Domination
First…Secular Bear Reversal Pattern – 2B – Key Level 185 USD
September 2011 – March 2022
Second… Long Term Bear Reversal Pattern – M – Key Level 195-193 USD
August 2020 – March 2022
vs
Third… Secular Bull Reversal Pattern – Inverted H&S or Cup with Handle
Key Level 177 USD
and
Bullish Flag Pattern – Key Level 178 USD
( Monthly Line Chart )
with
Bear Wave from 193 USD Zone ( 3.2022 ) to 150 USD Zone ( 9.2022 – 11.2022 )
Test Fib Ret 44.7% 150 USD Zone ( 9.2022 – 11.2022 )
Finally
Present Active
Bull Wave from 150 USD Zone
( Monthly and Weekly Charts )
Now dominating
Test Higher Psychological Key Level 180 USD Zone
Fib Ret 68.5% – 180 USD Zone
( Weekly Chart )
with
January Monthly Bull Candlestick
vs
MACD Monthly still Sell Signal vs near to Future Active Buy
GLD Present Battlefield
150 – 170 vs 180 185 195 USD
ATA Investment Conclusion
Special Focus on
150 – 170 vs 180 185 195 USD
Final Result of Test
Present Psychological Key Level 180 USD
Research New Pattern and Confirm or Cancel Present Pattern
Classical & Candlestick
with
Next Smart Money Move
New
Gold News
US Dollar DXY Strikes and News
Fed Verdict Verbal Strikes
Global Macro Economy News
Governments & Central Banks Strikes
Russia Moves Ukraine War – China – Taiwan News
Next Global Macro Strikes
Future Final Smart Money Reaction…
First…EOM – January
by the Golden Way
always remember
Gold – ANTI US Dollar Vector
SPDR Gold Shares Monthly & Weekly Charts
19.06.2015


SPDR Gold Shares Weekly Chart
30.07.2015

SPDR Gold Shares Monthly & Weekly Charts
20.08.2015
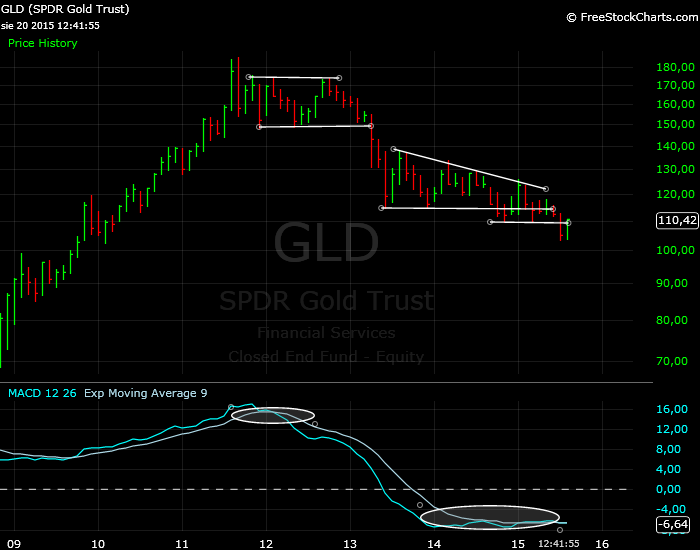

SPDR Gold Shares Monthly & Weekly Charts
6.04.2020 – EOD


SPDR Gold Shares Monthly Charts
20.08.2021 – EOD


US Dollar-DXY Index Gold Spot SPDR Gold Shares Monthly Weekly Charts
20.01.2023 – EOW


