…")
US 10Y BOND YIELD – Back Today on ATA Research Radar
ATA Continuation…
2018
10.01.2018 – US BONDS – END(LESS) SUMMER MOVE ON…
30.01.2018 – US 10Y BOND YIELD WARNING…
14.02.2018 – US 10Y BOND YIELD – The Show Must Go On…
25.04.2018 – US 10Y BOND YIELD – Who Wants to Live Forever…
16.05.2018 – US 10Y BOND YIELD – Mainstream Media Panic…
27.05.2018 – US 10Y BOND YIELD – PERFECT AMBUSH…
15.09.2018 – US 10Y BOND YIELD – Strategic Attack on Psychological 3%…
4.11.2018 – US 10Y BOND YIELD – GAME CHANGER in Action…
18.11.2018 – US 10Y BOND YIELD – TACTICAL SAFE BACK…
2019
16.01.2019 – US 10Y BOND YIELD – Back to Neutral Zone…
1.04.2019 – US 10Y BOND YIELD – NO MEGA SAFE ESCAPE…
29.05.2019 – US 10Y BOND YIELD – Awakening & Run to Safe Haven…
22.06.2019 – US 10Y BOND YIELD – from DEBT RUSH to DEBT AMBUSH…
7.07.2019 – US 10Y BOND YIELD – AMBUSH PROBABILITY RISING …
13.07.2019 – US 10Y BOND YIELD – AMBUSH SCENARIO GOES ON…
2020
10.05.2020 – US 10Y BOND YIELD – Bulls vs Bears Fighting in Debt Abyss…
16.05.2020 – US 10Y BOND YIELD – No Bear Strike on US Macro Most Disaster in over 100 Years…
5.06.2020 – US 10Y BOND YIELD – Back from US Debt Abyss…
8.08.2020 – US 10Y BOND YIELD – Waiting for Debt Godot…
with
ATA Following …
15.09.2018 – Financial Decade after Lehman Panic…
US 10Y BOND YIELD Major Motives
US DEBT Loosing Power
after
Powell Verbal Strike
on
Afterpandemic New Reality
US & Global Economy Reopen
V – Shaped Recovery Scenario Mainstream Projections
vs
Pandemic Second Wave Fear Strikes Back
FED-BOJ-ECB-BoE-Biggest ever Black Swans
Minsky Moment Flat Money “Printing” System
vs
Coronavirus “Ugly Duckling”-Trigger
ATA US 10Y BOND YIELD Conclusion
Long Term Horizon
Wall Street Factor for US 10Y BOND YIELD
still High Probability
of
2000 Year DOT.COM Bubble Burst DEJA VU Scenario
or even
1929 Great Depression
with
Guggenheim “PONZI SCHEME” Collapse Warning
Central Banks driven ‘Ponzi Scheme’ must Collapse
Tech Bubble High Risk
GLOBAL FLAT MONEY ERROR SYSTEM MEGA RISK

First of All…ATA from 15.09.2018
” ATA Strategic Conclusion
NEXT CRISIS
will be
GLOBAL DEBT ARMAGEDDON…!!! ”
First…ATA from 8.08.2020
” special focus on
Psychological Key Levels active Zone
0.30% 0.50% vs 0.80% 1%
with
Result of Present Testing Psychological Key Level 0.50% ”
&
ATA US Bonds Last Tweets
Second…Present US 10Y BOND YIELD Situation
ATA MARKET MODEL IN LONG TERM ACTION
ATA MIND OVER MARKETS
Charts have No Temperature
Markets Never Wrong vs Often Mistaken
Hope is Not a Strategy
Follow the Trendlines Not the Headlines
Failed Signal is the Strongest Signal
ATA MARKET MODEL
First…Market Motive…
Second…Market Technical Pattern…
Final…INVEST & TRADE – DON’T FORECAST…
First…Key Master Motives
above in this text…
Second…Market Technical Patterns
after Activated
First…
Long Term 2B Risk Off Pattern
Psychological Key Level 3.00%
stricte
US 10Y Bond Yield – Perfect Ambush
Second…
Falling US Yield Scenario
Break Down Key Level 2.00%
Falling Continuation
Break Down Key Level 1.00%
with
Last Test 0.30% Key Level Zone
( March Low 0.318% )
&
Latest Bull Contraction to Psychological Key Level 1.00%
Now dominating
New Bull Contraction
from
Psychological Key Level 0.50% Zone
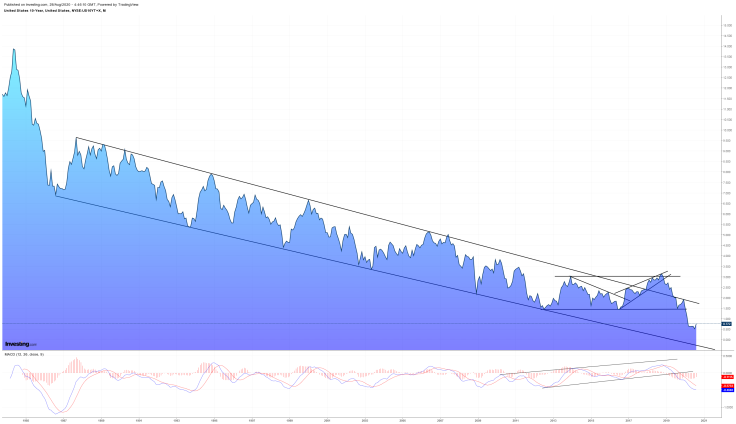
US Yield Long Term Picture
still showing
Domination of Bear Scenario
Falling US Yield
what most important
in the Wider Market Perspective
Yield still inside Secular Bear Channel
with
Incredible Targets
Entering Negative Territory
– 0.30% Zone
after
Activated Long Term 2B Risk Off Pattern
in Psychological Key Level 3.00%
stricte
US 10Y Bond Yield – Perfect Ambush
but with
Present Stop Bear Wave
for Now Bull Strikes Back
from
Psychological Key Level 0.50%
with
Future Test Higher Psychological Key Level 1.00%
( Monthly Chart )
ATA Research Conclusion
still special focus on
Psychological Key Levels active Zone
0.30% 0.50% vs 0.80% 1%
with
Result of Present Testing Psychological Key Level 0.50%
ATA Research still Active Thesis – US 10Y BOND YIELD
Now still Most depends of…
FED & Powell Strikes with US Macro Figures
and of course
Coronavirus Waves
ATA Investment Conclusion
still Focus carefully on
Psychological Key Levels 0.30% 0.50% vs 0.80% 1%
with
New FED Actions & US Macro
never forget
Next US DEBT Strike can move others…
First…DEBT MARKETS
Second…WALL STREET
Finally…GLOBAL EQUITY MARKET
with
NEW GOLDEN RUSH…
N-TIMES
Chart is More Important than 1000 Words…
&
Most Important s Final Smart Money Reaction…
First…EOM – Now Key Month August
US 10Y BOND YIELD Big Picture – Monthly Charts :
10.01.2018

30.01.2018

14.02.2018

25.04.2018

16.05.2018

25.05.2018

14.09.2018

2.11.2018

US 10Y BOND YIELD Big Picture – Monthly & Daily Charts :
16.11.2018


US 10Y BOND YIELD Big Picture – Monthly , Weekly & Daily Charts :
16.01.2019


1.04.2019


29.05.2019


21.06.2019


5.07.2019


12.07.2019


US 10Y BOND YIELD Big Picture – Monthly , Weekly & Daily Charts :
8.05.2020


15.05.2020


US 10Y BOND YIELD Big Picture – Monthly Charts
4.06.2020 – EOD


7.08.2020 – EOD


27.08.2020 – Assian Session