

PHLX Gold/Silver Sector Index – All Time on ATA Research Radar
ATA Continuation of…
2019 Last
27.12.2019 – PHLX Gold/Silver Sector Index – 2019 New High…
2020 Last
27.03.2020 – PHLX Gold/Silver Sector Index – Next GOLDEN FALL…
15.04.2020 – PHLX Gold/Silver Sector Index – Bull Attack on January-February 2020 Top Zone…
with
ATA Following …
Gold American Eagle Coin
28.04.2020 – GOLD AMERICAN EAGLE – Long Term Perspective…
Gold Krugerrand Coin
28.04.2020 – GOLD KRUGERRAND – Long Term Horizon…
GOLD Spot & Futures
23.04.2020 – GOLD – Spot vs Futures – Perfect Touch & Strike…
Gold Spot – XAU/USD
9.04.2020 – GOLD Spot – Secular Golden Fibonacci Constellation …
Gold Futures
5.05.2020 – GOLD Futures – Secular Golden Fibonacci Constellation…
DJ US Gold Mining Index
19.04.2020 – DJ US Gold Mining Index – Golden Fight in Secular Resistance Zone…
with
GOLD Financial Instruments Spectrum
7.04.2020 – GOLD – GOLDEN SECULAR SPECTRUM …
Philadelphia Gold and Silver Index
5.04.2020 – Philadelphia Gold and Silver Index – Secular Clash of the Immortals…
NYSE Arca Gold BUGS Index
5.04.2020 – NYSE Arca Gold BUGS Index – Secular Clash of the Titans…
Barrick Gold
4.04.2020 – Barrick Gold – New Golden Strike with Risky Shining…
PHLX Gold/Silver Sector Index Major Motives
First of All
Golden Danger Red Light ON
Mainstream Media non stop creating Golden Shinig Story…
vs
Golden Crowd attacking Mints…want buying All Coins…
PHLX Gold/Silver Sector Index like Gold Spot & Futures
No Strong Golden Bull Reaction
against all
Macro Odds with Scary Last Hard Data & Scary Predictions
with
Golden Contango Dynamic still Fall Off
on
TRUMP – US Economy Reopen Decision
&
Economies show Signs of Restarting
of course with
USD Master F/X Vector for PHLX Gold/Silver Sector Index
FED-BOJ-ECB-BoE-Biggest ever Black Swans
Minsky Moment Flat Money “Printing” System
vs
Coronavirus “Ugly Duckling”-Trigger
&
FED “Central Printing Projection”
Balance Sheet Skyrocket Rising Future Move
Japanification in Global Central Action
BOJ Mega Easing Process
with
Gold Bear Contraction
even against
Cancel for Now F/X Reason
USD – Main Global Currency Bear Strike
ATA Golden Conclusion
Long Term Horizon
Wall Street Factor for PHLX Gold/Silver Sector Index
still High Probability
of
2000 Year DOT.COM Bubble Burst DEJA VU Scenario
or even
1929 Great Depression
with
Guggenheim “PONZI SCHEME” Collapse Warning
Central Banks driven ‘Ponzi Scheme’ must Collapse
Tech Bubble High Risk
GLOBAL FLAT MONEY ERROR SYSTEM MEGA RISK

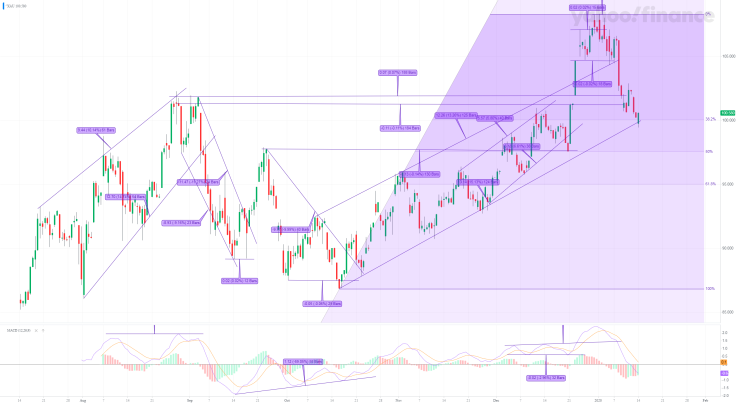
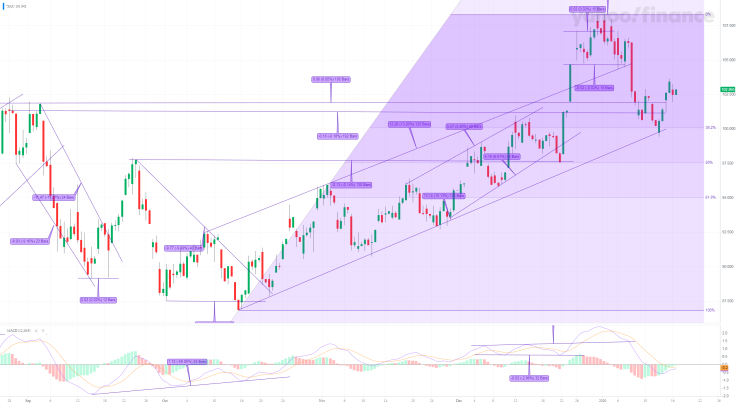
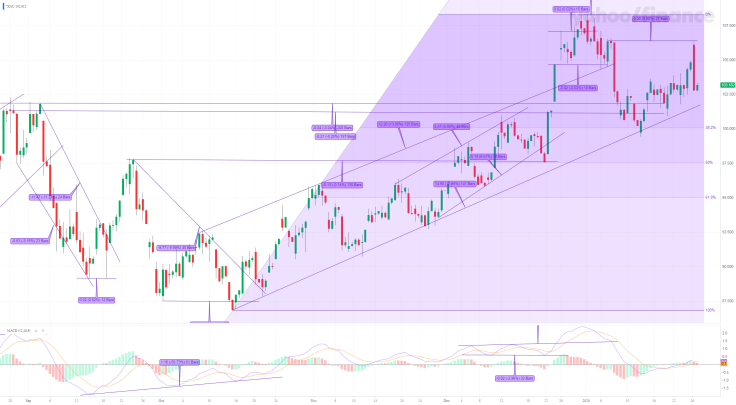
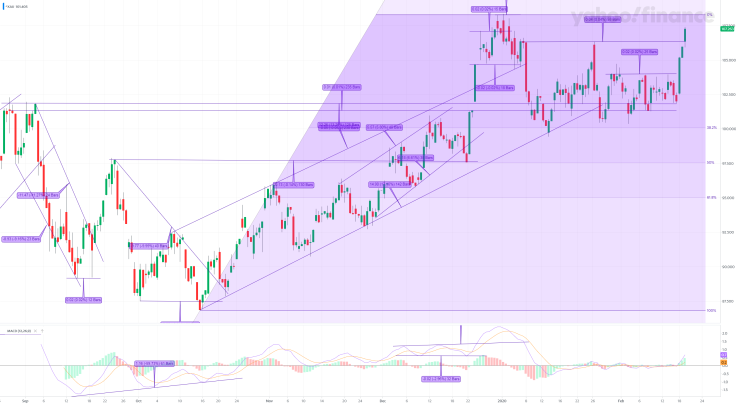
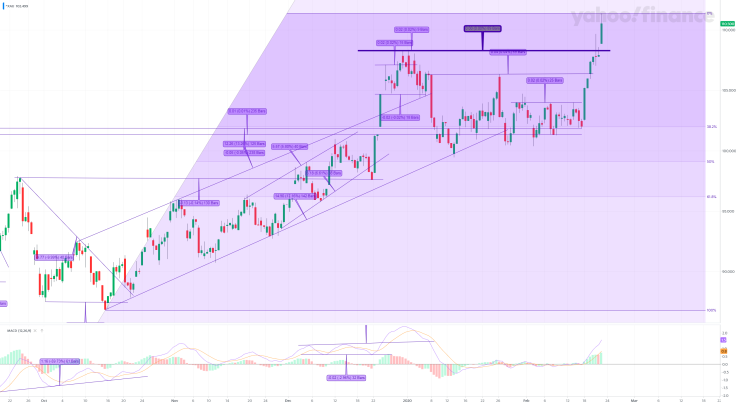
First…ATA from 15.04.2020
” Now dominating
New Testing January-February Top Zone
vs
No New Highs
only Attack on January – February 2020 Top Zone
with still Active
Negative Divergence
PHLX Gold/Silver Sector Index vs GOLD Futures
PHLX in 100 Key Level Zone
with
Bear Strikes
Gold Fut Back to Key Level 1750 USD Zone
( Now 1745 USD )
but
Silver Fut still under Key Level 15 USD
( Now 14.45 USD ) ”
&
First…ATA Golden Tweets
Second…Present PHLX Gold/Silver Situation
PHLX Gold/Silver MEDIUM – SHORT TERM SITUATION
ATA MIND OVER MARKETS
Hope is Not a Strategy
Follow the Trendlines Not the Headlines
Failed Signal is the Strongest Signal
ATA MARKET MODEL
First…Market Motive…
Second…Market Technical Pattern…
First…Key Motives
above in this text…
Second…Market Technical Patterns
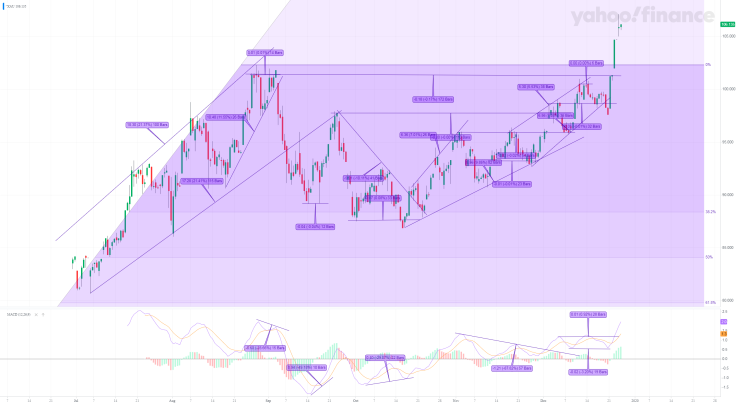
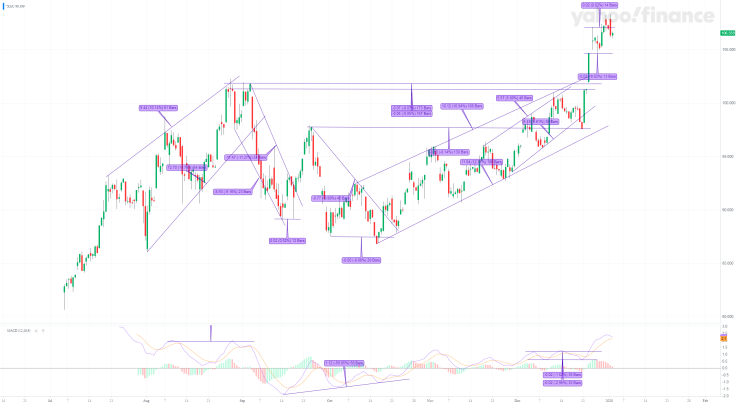
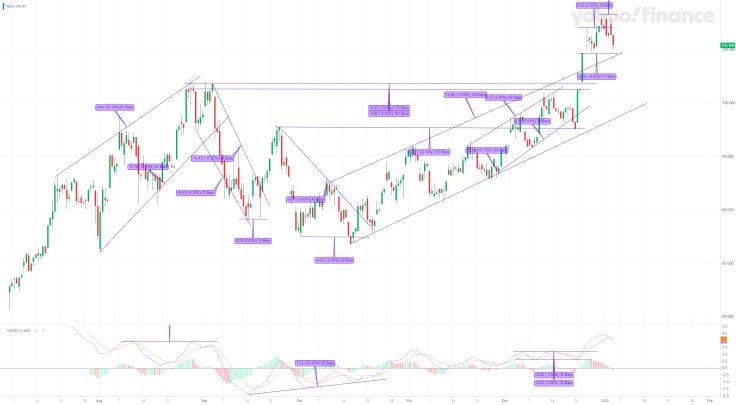
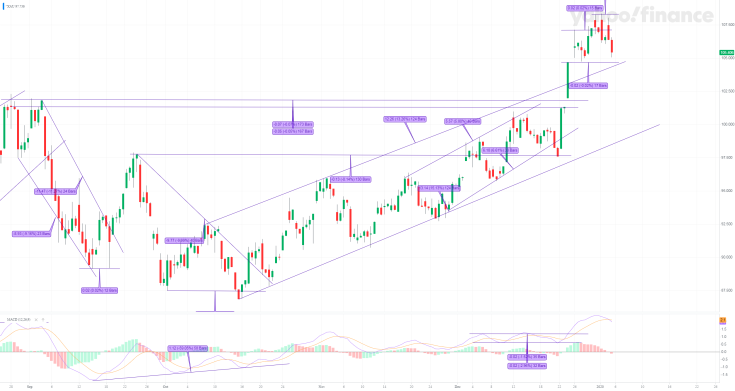
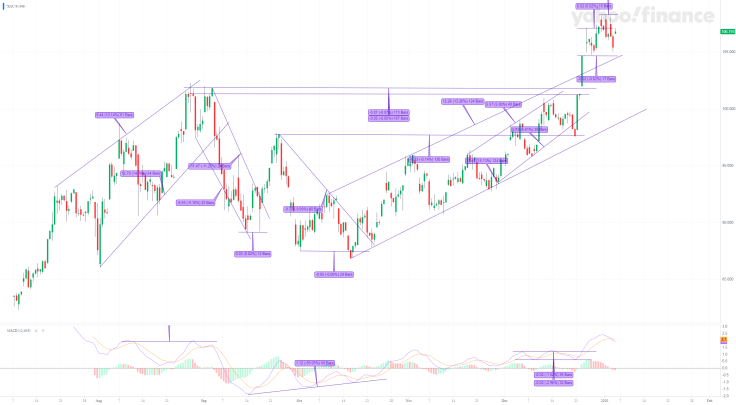
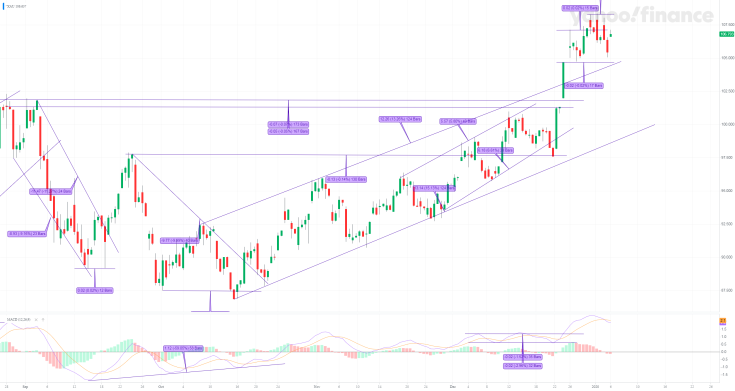
Gold/Silver Short Term View
( Intraday H4 Charts )
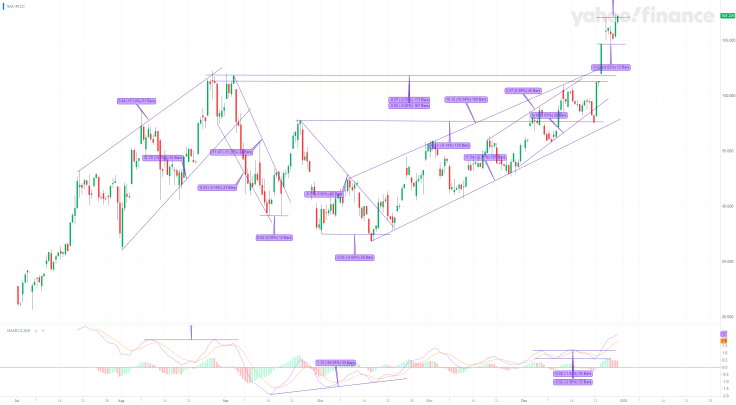
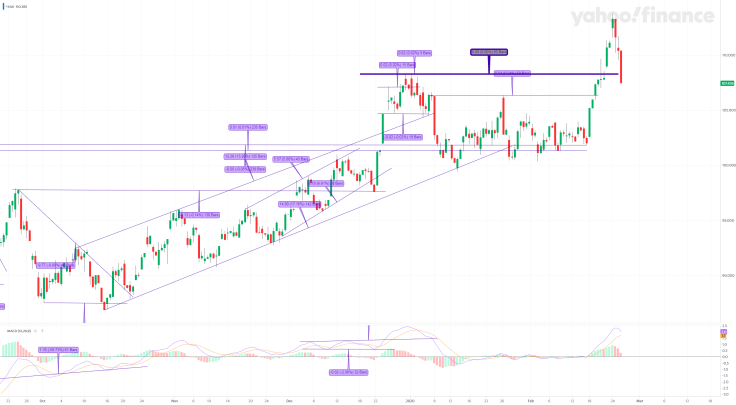
Gold/Silver Index
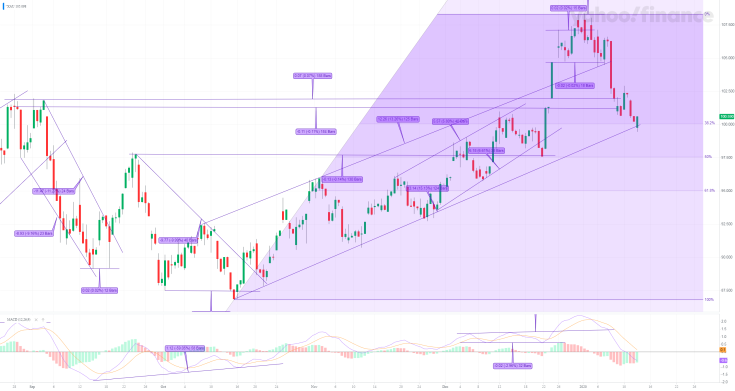
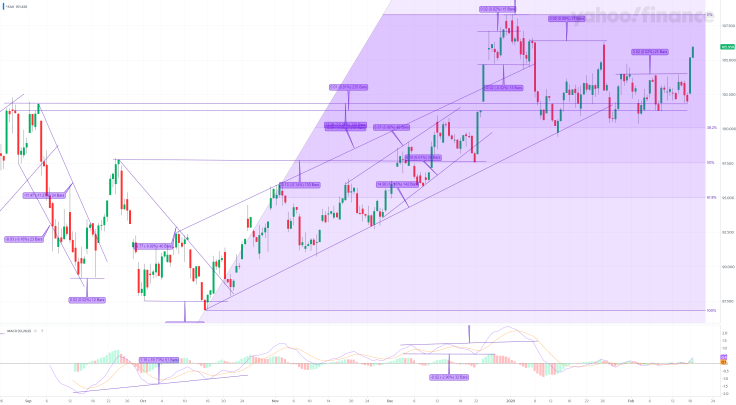
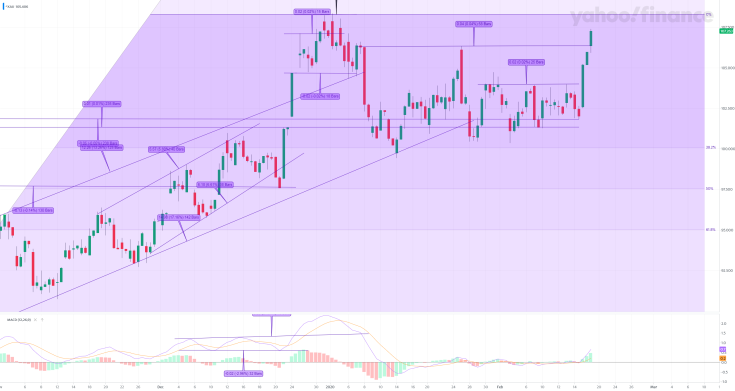
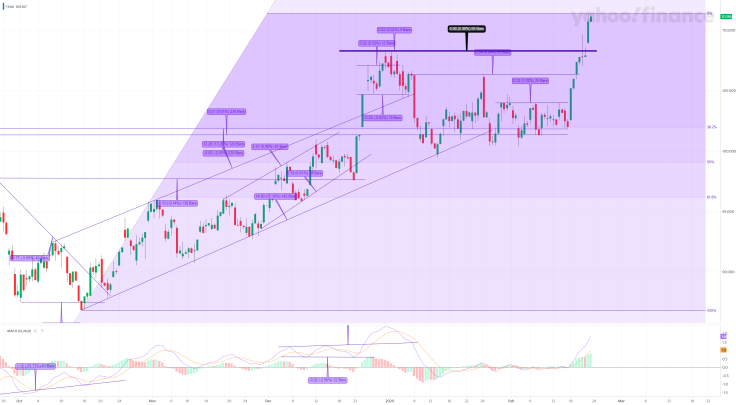
After Activated chronological
January – February 2020
Gold Panic Buying Top
Golden Ambush
March 2020
Golden Waterfall Pattern
Dynamic Golden Sell Off
with
Second Half – March 2020
Activated
Bull Reversal Pattern – W – Key Level 70
New Golden Shot Up
Acceleration Move Up outside Last Diagonal
Jump above January-February Top Zone
&
Created New High in 120 Key Level Zone
( High 120.28 )
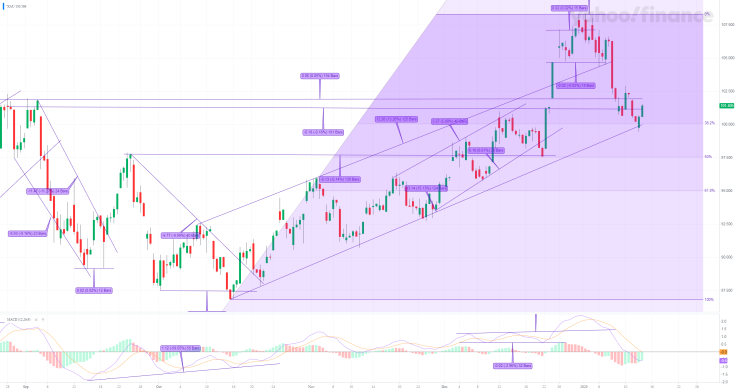
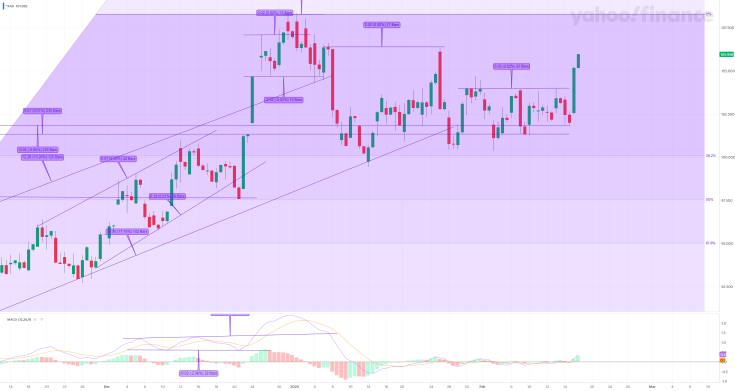
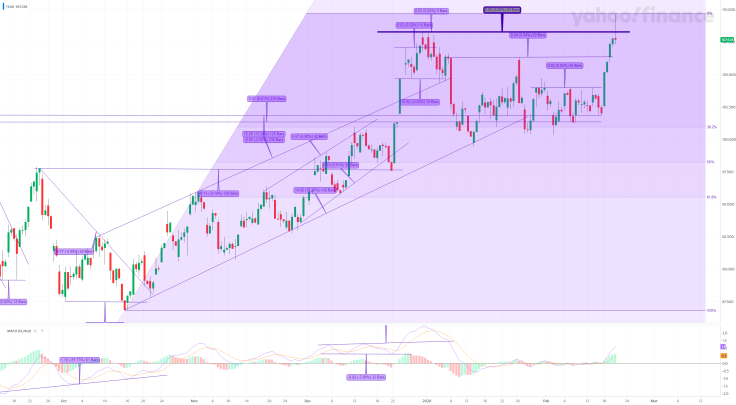
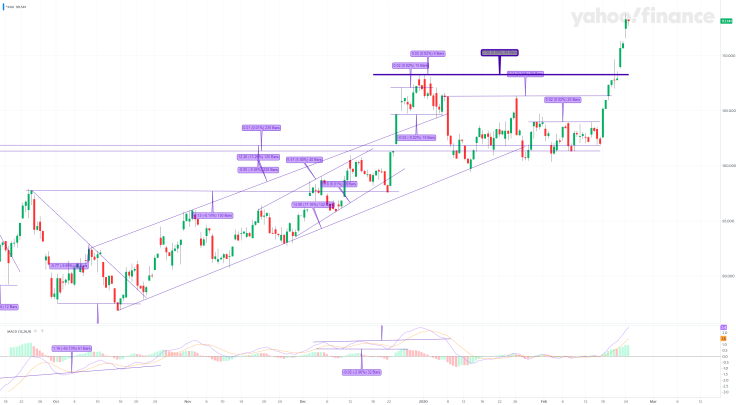
Now dominating
New Bear Contraction
with
Bull Trap Rising Risk
2B Bear Reversal Pattern Risk
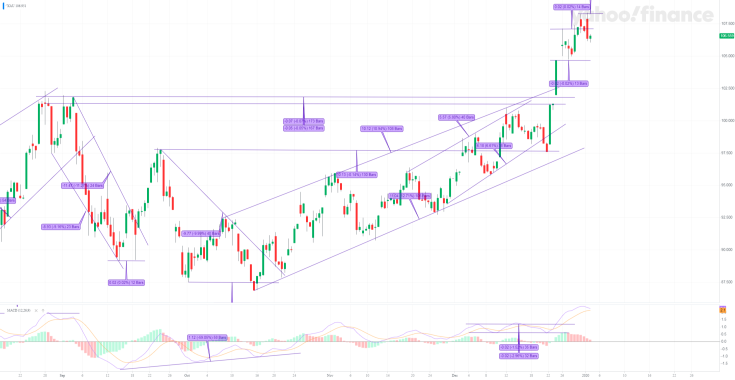
Key Level 113.80
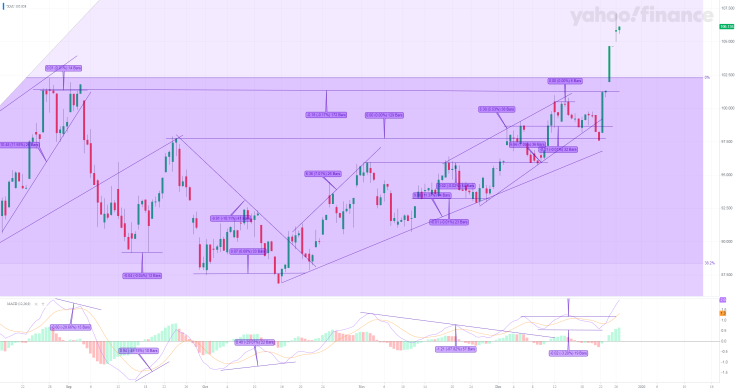
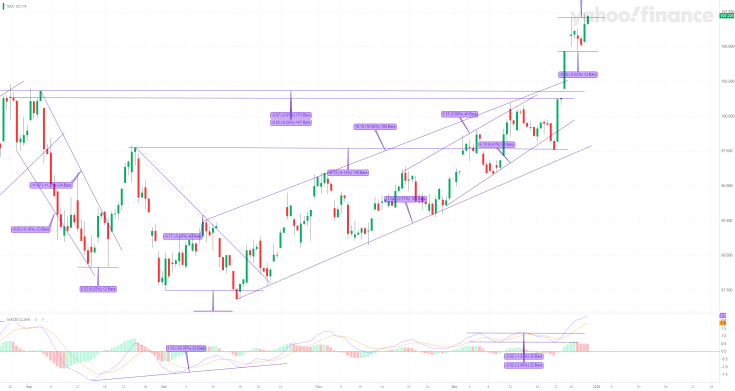
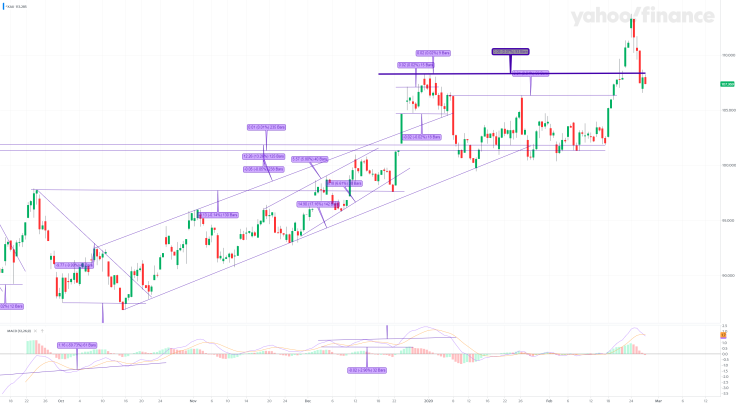
for Now
Back under February 2020 Top Zone
vs
still above January 2020 Top Key Level 108 Zone
&
Last Yesterday H4 Bear Candlesticks
MACD H4 Sell Signal
Negative Divergence
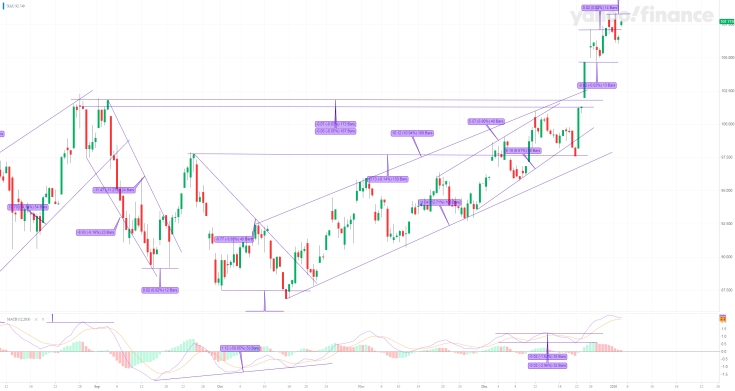
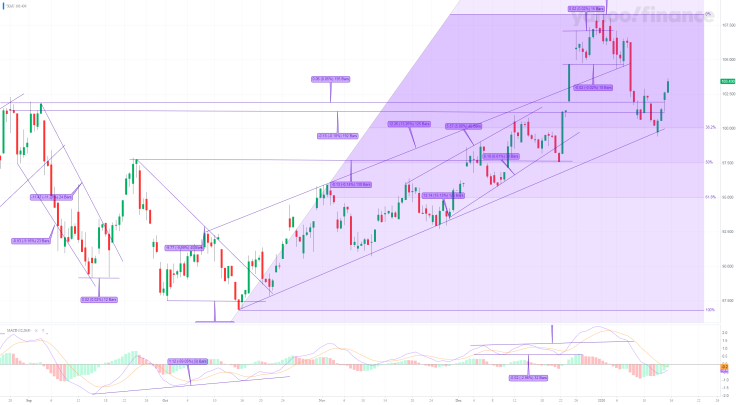
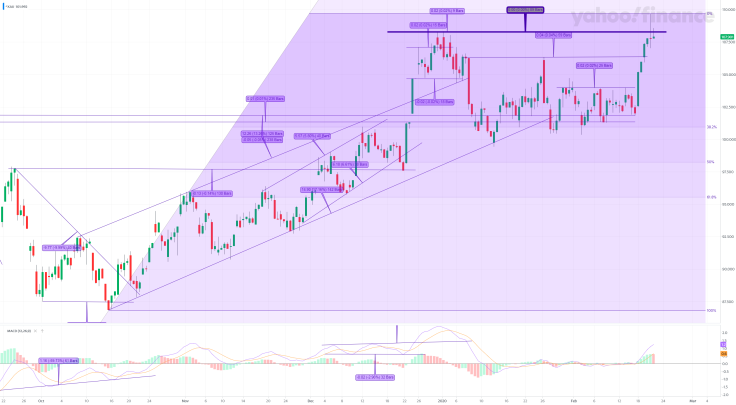
with waiting for
Next Global – US -EU – CHINA Macro Strikes
New Coronavirus Strikes
&
Central Banks, FED,US Senate Trump,Mnuchin, Powell, Kudlow Strikes
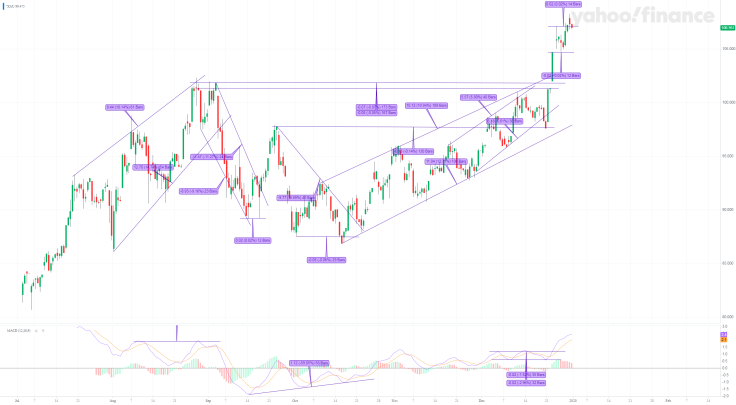
with still Active
Bear Strikes
Gold Fut Back to Key Level 1700 USD Zone
( Now 1686 USD )
but
Silver Fut Back under Key Level 15 USD
( Now 14.91 USD )
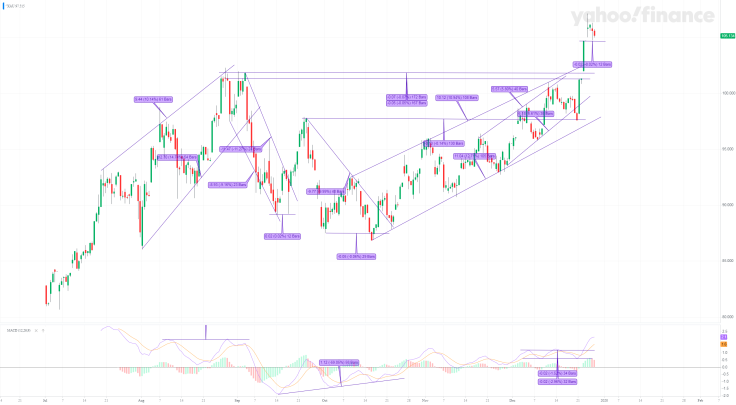
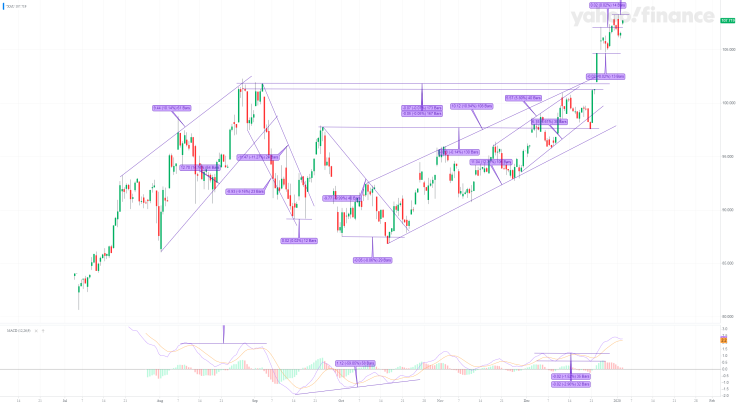
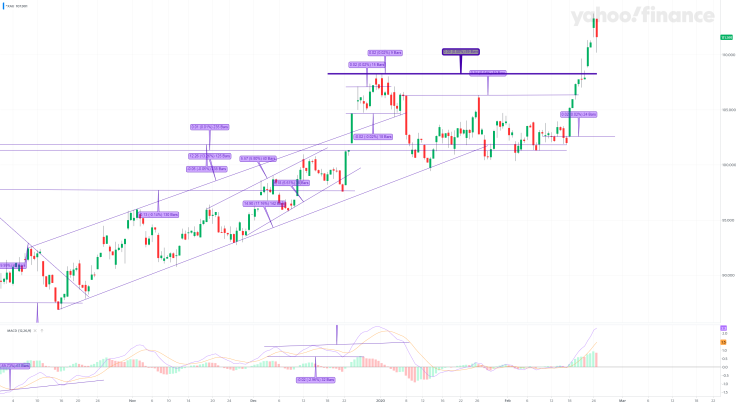
Gold-Silver Short Term Battlefield
100 – 108 vs 115 – 120 Key Levels Zone
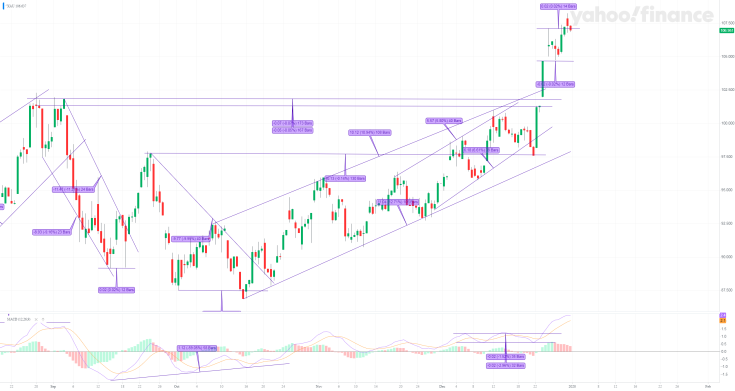
ATA Investment Conclusion
special focus on
Present Golden Range
100 – 108 vs 115 – 120 Key Levels Zone
Present Major 113
&
Silver Fut
Psychological Key Level 15 USD
Gold Fut
Psychological Key Levels 1700 USD
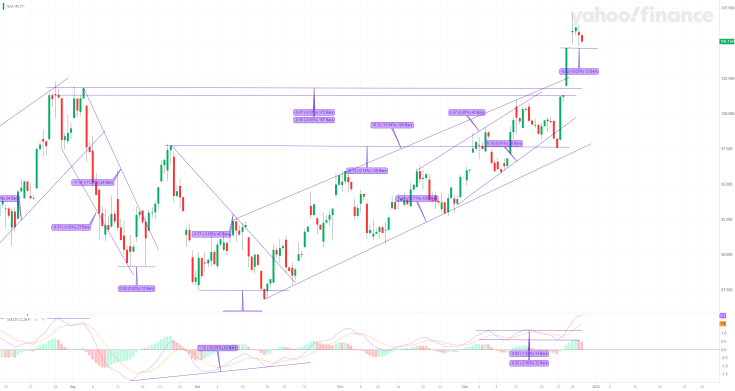
with
Looking for
Conformation or Cancel
2B Bear Reversal Pattern Risk
Key Level 113.80
Time Filter
and waiting for
Next Global – US -EU – CHINA Macro Strikes
New Coronavirus Strikes
&
Central Banks Strikes
ATA Maximes
MAJOR TOPS WERE ALWAYS CREATED on SUPER GOOD NEWS
with
EUPHORY PHASE …!!!
vs
MAJOR BOTTOMS WERE ALWAYS CREATED
on
SUPER NEGATIVE NEWS
with
PANIC PHASE
Market Trend always changed when Mainstream Media created
One Slogan ” No Chance for Change “…
that’s why
Charts show you Reversal Pattern First ex ante…!!!
N – TIMES
Finally …
F/X & Metals Maximes
Risk strikes Fast…
Chart is More Important than 1000 Words…
Most Important is Final Smart Money Reaction….
First..Today H4 & EOD
PHLX Gold/Silver Sector Index Intraday H4 Charts :
26.12.2019 – EOD
14.01.2020 – ( First Half US Session )
14.01.2020 – EOD
15.01.2020 – EOD
16.01.2020 – EOD
27.01.2020 – EOD
18.02.2020 – EOD
19.02.2020 – ( Second Half US Session )
20.02.2020 – ( Half US Session )
20.02.2020 – EOD
21.02.2020 – ( First Half US Session )
21.02.2020 – EOD
24.02.2020 – ( Second Half US Session )
24.02.2020 – EOD
25.02.2020 – EOD
26.02.2020 – EOD
28.02.2020 – EOD

2.03.2020 – EOD

3.03.2020 – EOD

4.03.2020 – EOD

5.03.2020 – EOD

6.03.2020 – EOD

9.03.2020 – EOD

11.03.2020 – ( Second Half US Session )

13.03.2020 – EOD

18.03.2020 – EOD


13.04.2020 – EOD

14.04.2020 – EOD

30.04.2020 – EOD

