
After
Australian Dollar…
AUSTRALIAN DOLLAR – TRUMP TRADE WAR F/X VICTIM…
&
AUSTRALIAN DOLLAR FIGHTING with TRADE WAR PHANTOM…
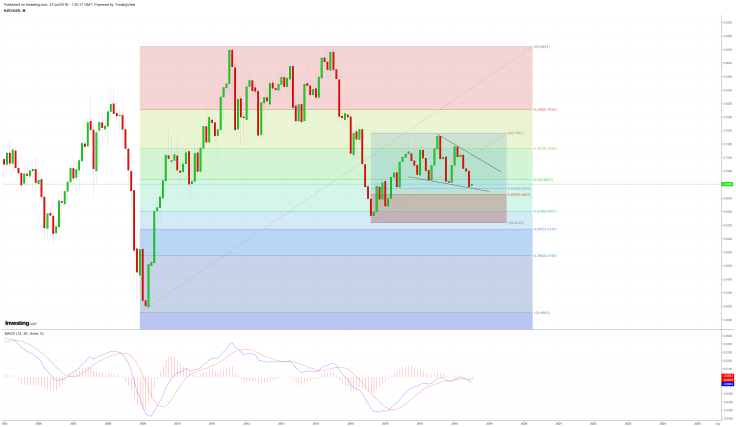
New Zealand Dollar also shows…
First RISK ON Wave Signal…!!!

ANTIPODES CURRENCY is Now Perfect F/X Barometer
with
Fibonacci Help…
Look at NZD/USD Charts
with
Big & Small FIB RET….
In both..
KIWI Cases…
we can see how FIB RET Zone ( 61.8% – 68.5% ) supported NZD…
ATA KIWI Investment Conclusion
Compilation of…
Fib Ret Monthly ; Weekly & Daily Charts
with
Wedge Pattern ( Monthly & Weekly Charts )
&
W Pattern ( Daily Chart )
going to show
Present Most Important Key Levels Zones – 0.6653 – 0.6741
NZD/USD Monthly , Weekly & Daily Charts :