

PHLX Gold/Silver Sector Index – All Time on ATA Research Radar
ATA Continuation of…
2019 Last
27.12.2019 – PHLX Gold/Silver Sector Index – 2019 New High…
2020
3.01.2020 – PHLX Gold/Silver Sector Index – IRAN GOLDEN Strike…
6.01.2020 – PHLX Gold/Silver Sector Index – No New 2020 High vs IRAN Rising Risk…
14.01.2020 – PHLX Gold/Silver Sector Index – GOLDEN AMBUSH Rising Risk…
17.01.2020 – PHLX Gold/Silver Sector Index – ESCAPING from GOLDEN AMBUSH…
28.01.2020 – PHLX Gold/Silver Sector Index – from BEAR TRAP to BULL TRAP on Coronavirus Strike…
19.02.2020 – PHLX Gold/Silver Sector Index – GOLDEN DISTRUST…
21.02.2020 – PHLX Gold/Silver Sector Index – Present Breaking Down after Yesterday Knocking on Golden Heavens Door…
24.02.2020 – PHLX Gold/Silver Sector Index – Golden Panic Buying Top Rising Risk…
27.02.2020 – PHLX Gold/Silver Sector Index –New GOLDEN AMBUSH…
PHLX Gold/Silver Sector Index Master Motive
Coronavirus Panic Symptoms
from China to Japan , South Korea & Italy
Now special in Europe – Italy
with
CDC – US Coronavirus Strike
US First Possible ‘ Community Spread’
&
US Coronavirus Strike First Death
vs
Trump No Reason to Panic
&
US – Global Perspective
Tech Boom Cycle
Central Banks Mega Easing
Big Techs Buybacks
vs
Guggenheim “PONZI SCHEME” Collapse Warning
Central Banks driven ‘Ponzi Scheme’ must Collapse
Tech Bubble High Risk
GLOBAL FLAT MONEY ERROR SYSTEM MEGA RISK
GLOBAL EQUITIES SELL OFF HIGH RISK
Global & CHINA – US – EU – UK Slowdown & Recession Risk
ATA Golden Conclusion
After Activated
Gold Panic Buying Top
&
Golden Ambush
on
Coronavirus Panic
Now dominating
Golden Waterfall Pattern
even on
USD Strong Bear Strike

First…ATA from 27.02.2020
” After
GOLDEN Panic Buying TOP
Now dominating
Dynamic Shot Down
&
Back under January Top Zone
creating on
IRAN WAR Risk
Key Levels 108 – 108.35
Finally
Activated 2B Pattern – Golden Ambush ”
Second…Present PHLX Gold/Silver Situation
PHLX Gold/Silver MEDIUM – SHORT TERM SITUATION
ATA MIND OVER MARKETS
Hope is Not a Strategy
Follow the Trendlines Not the Headlines
Failed Signal is the Strongest Signal
ATA MARKET MODEL
First…Market Motive…
Second…Market Technical Pattern…
First…Key Motives
above in this text…
Second…Market Technical Patterns
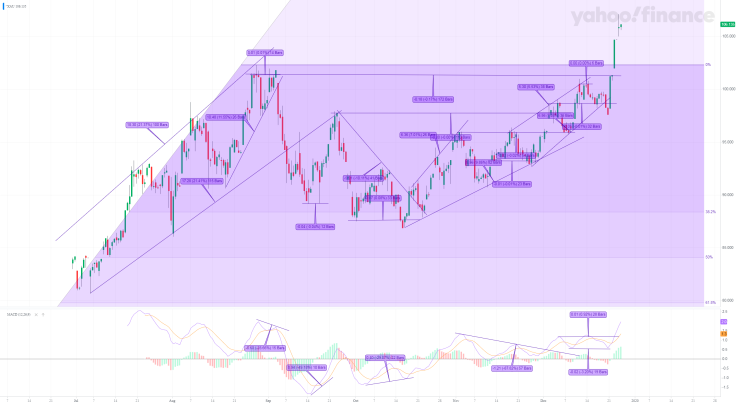
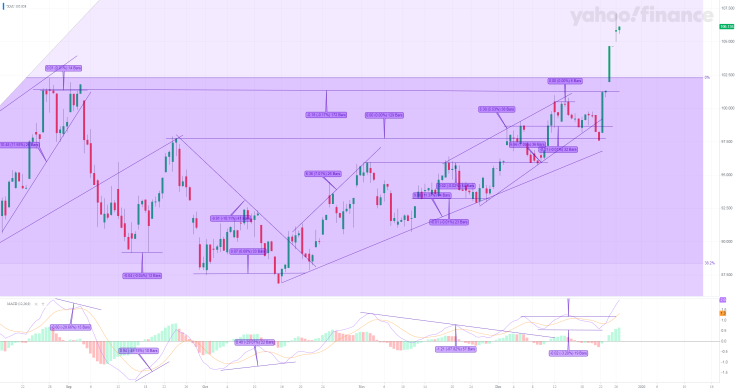
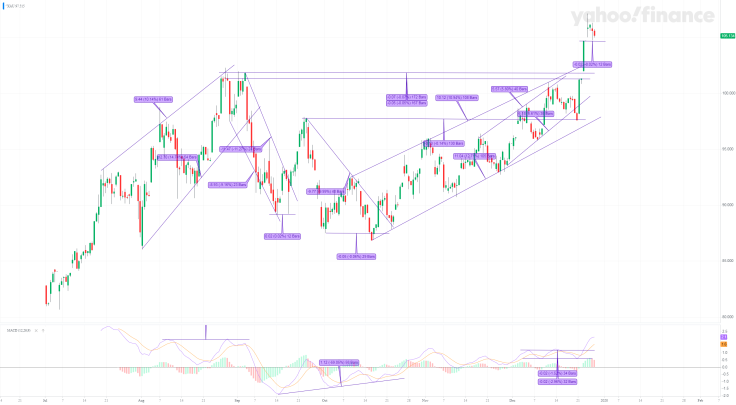
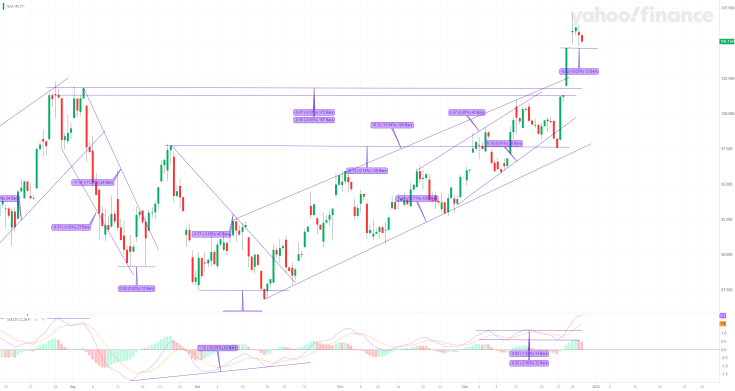
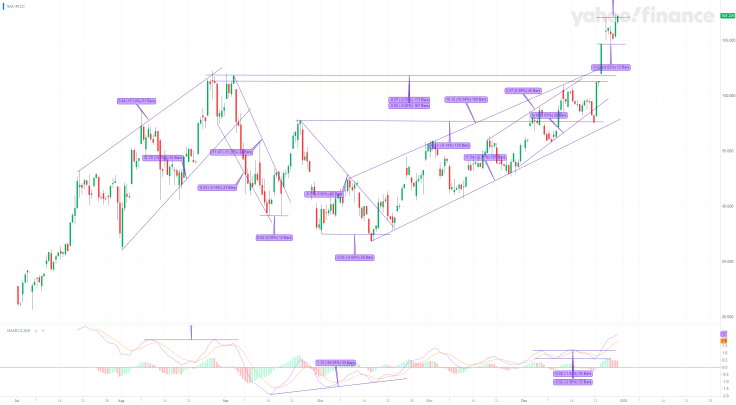
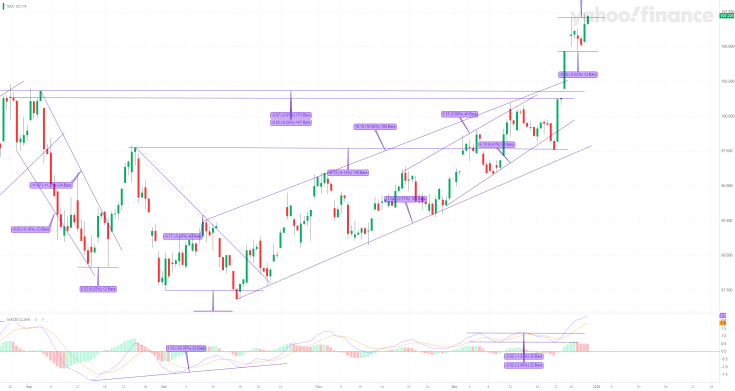
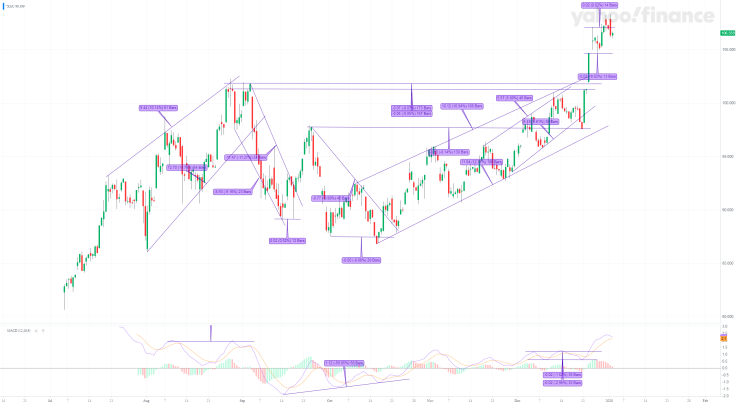
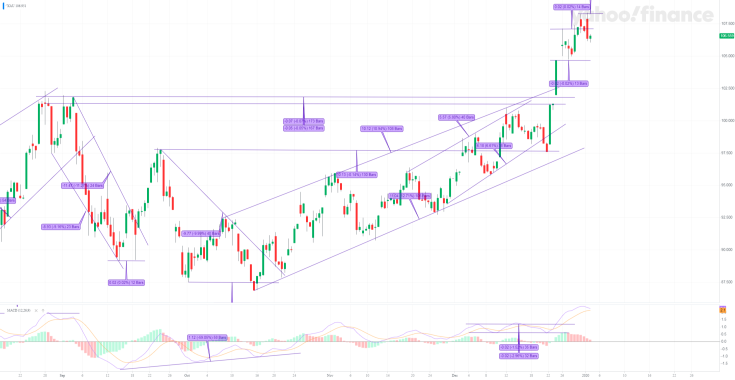
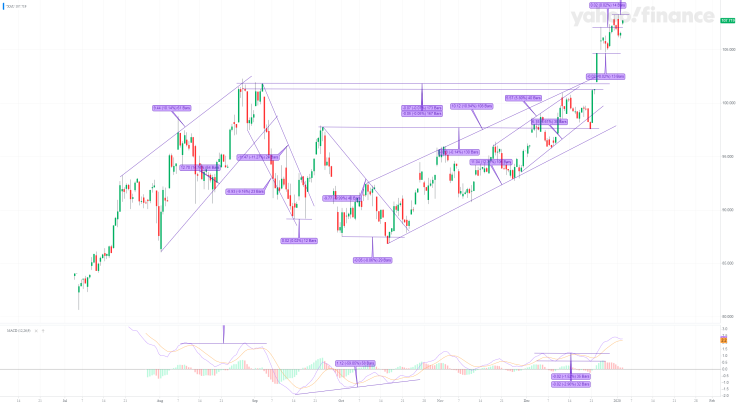
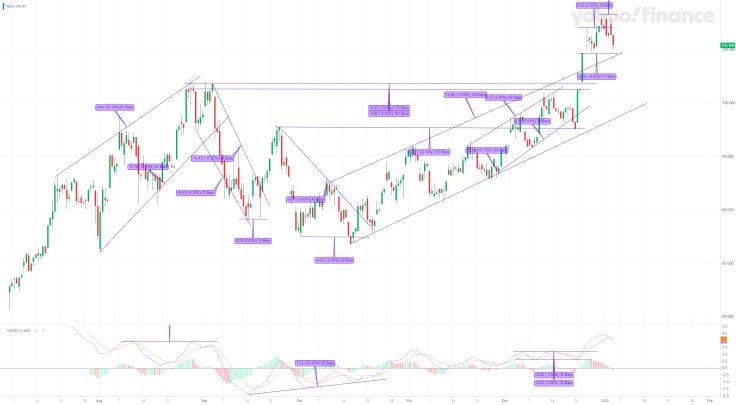
Gold/Silver Short Term View
( Intraday H4 Charts )
Gold/Silver Index
After Activated
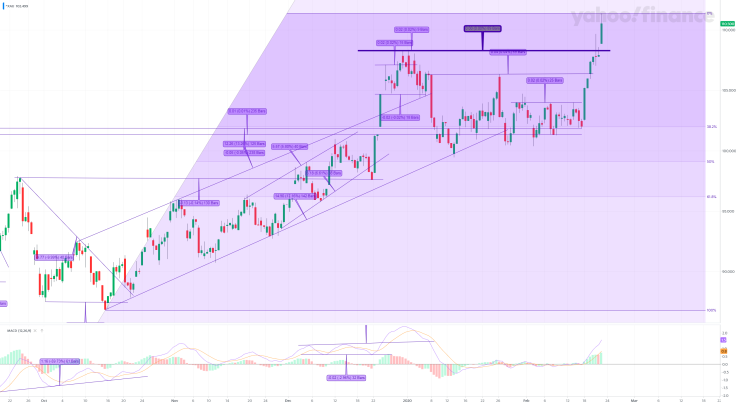
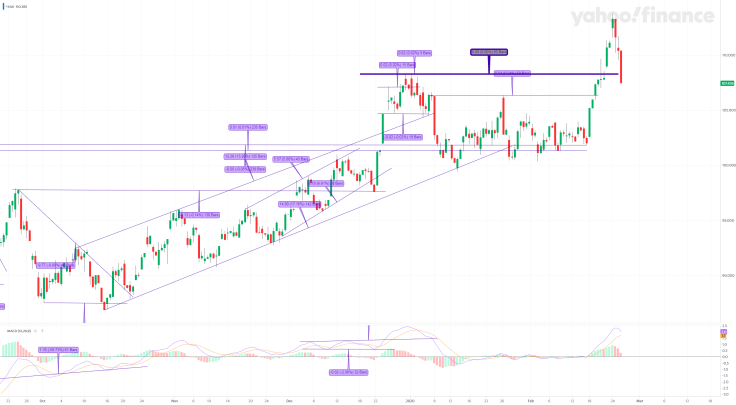
First….GOLDEN Panic Buying TOP
Psychological Zone Key Levels 113 – 115
Second…2B Pattern – Golden Ambush
Back under January Top Zone 108 – 108.35
creating on IRAN WAR Risk
Now dominating
Golden Waterfall Pattern
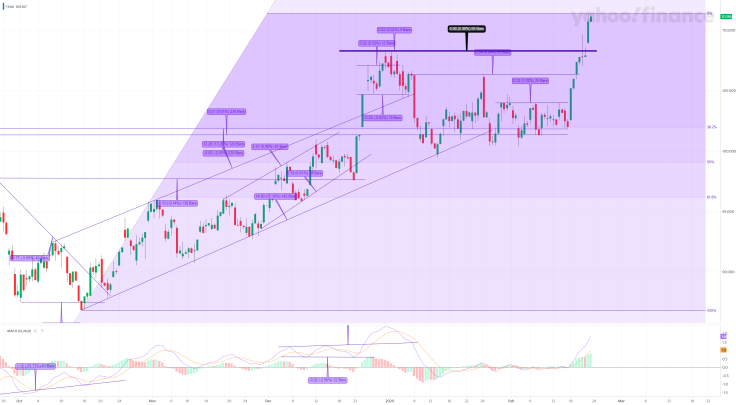
with
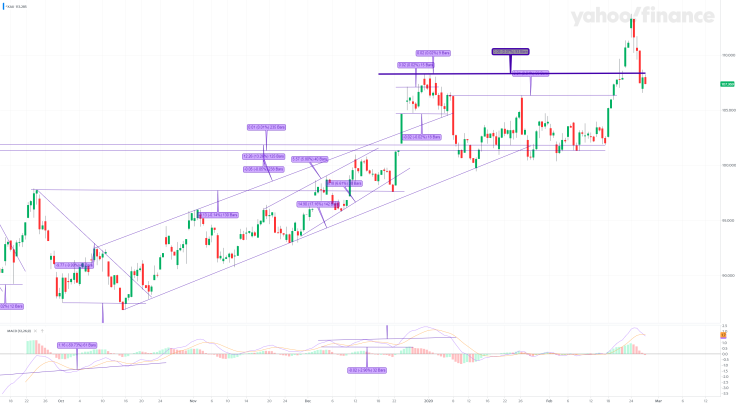
Golden Shot Down under Psychological 100
Testing Lower 90 Zone
vs
Active Defense 90 Key Level with Bull Contraction
2 Last H4 candlesticks – Lower Shadows
&
MACD H4 Sell Signal
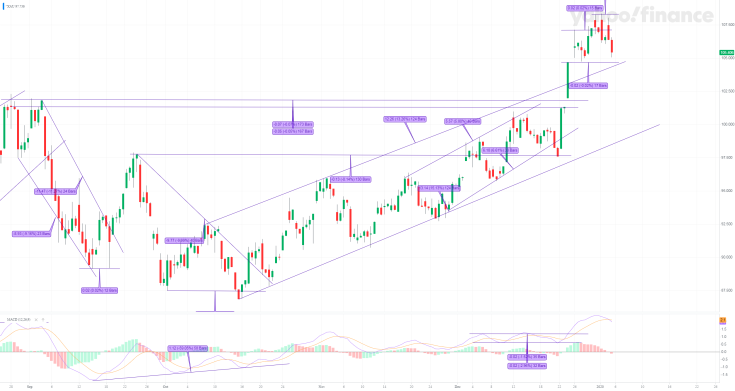
with
Gold Fut Strong Bear Strike
under Psychological Key Level 1600 USD
( Now 1587.15 USD )
with
Silver Fut Dynamic Shot Down
under Psychological Key Level 17 USD
( Now 16.457 USD )
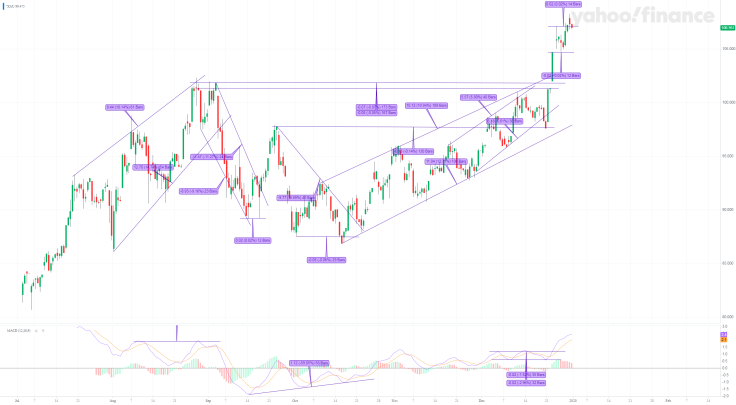
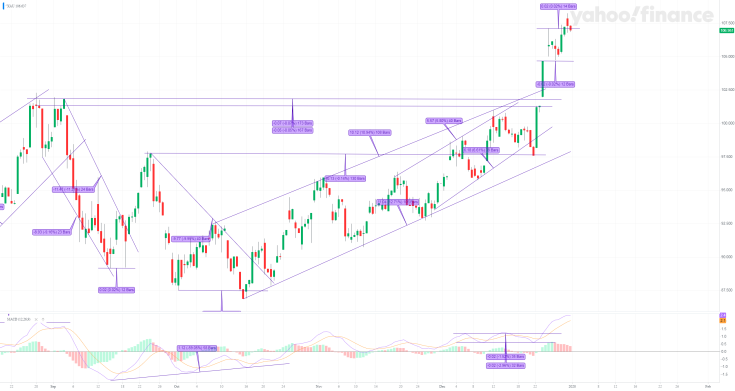
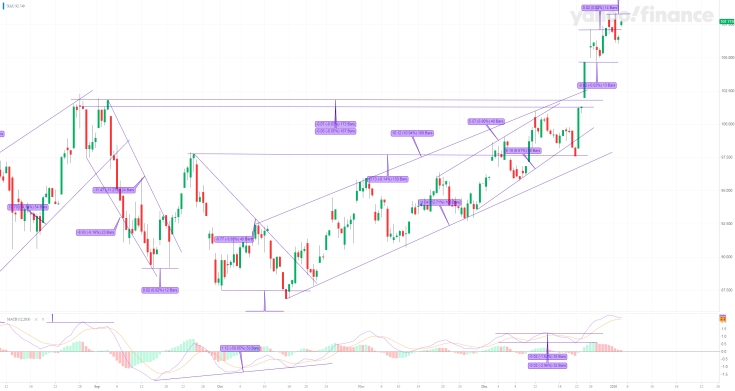
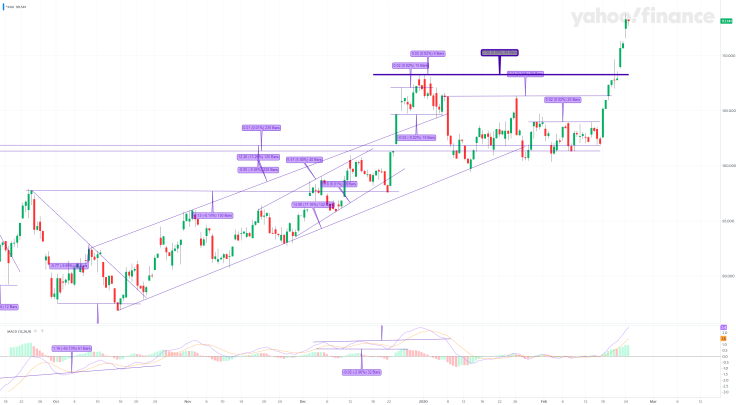
Gold-Silver Short Term Battlefield
90 vs 100
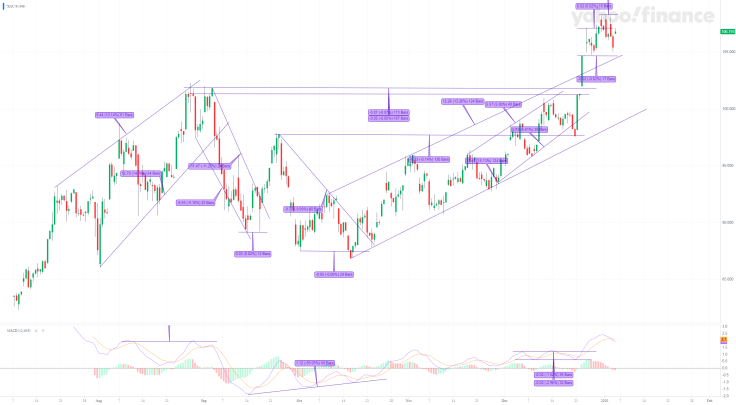
ATA Investment Conclusion
After Activated
GOLDEN BULL AMBUSH
2B Pattern
dominating
Golden Waterfall Pattern
with
Test 90 Key Level Zone
by the Golden way
Golden Ambush – Bullish for Wall Street
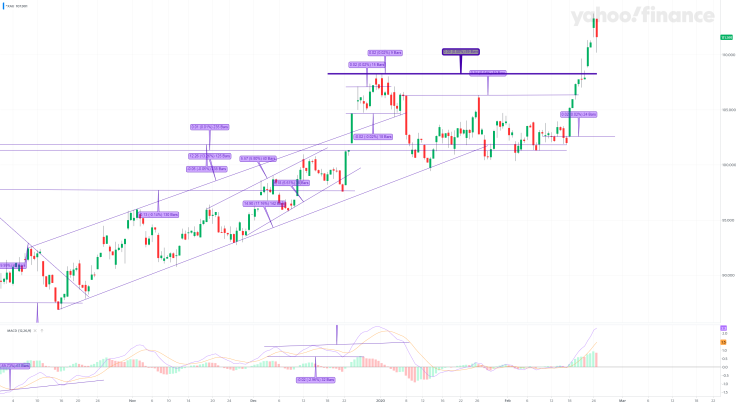
so special focus on
Present Golden Range
90 vs 100
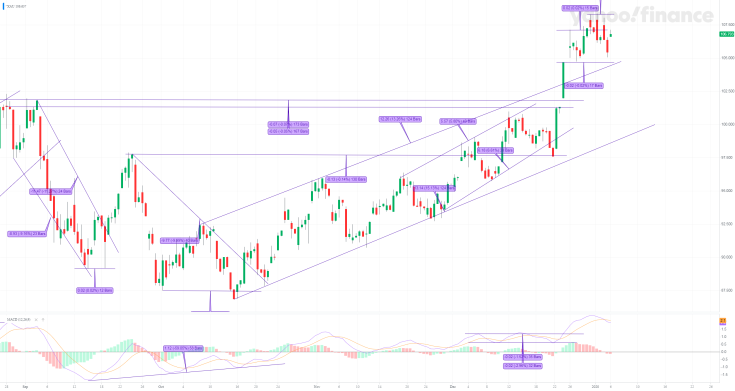
with
Silver Fut
Psychological Key Levels 16 vs 17 USD
Gold Fut
Psychological Key Levels 1550 vs 1600 USD
with
Looking for
New Pattern Research Classic & Candlestick
Time Filter
ATA Maximes
MAJOR TOPS WERE ALWAYS CREATED on SUPER GOOD NEWS
with
EUPHORY PHASE …!!!
vs
MAJOR BOTTOMS WERE ALWAYS CREATED
on
SUPER NEGATIVE NEWS
with
PANIC PHASE
Market Trend always changed when Mainstream Media created
One Slogan ” No Chance for Change “…
that’s why
Charts show you Reversal Pattern First ex ante…!!!
N – TIMES
Finally …
F/X & Metals Maximes
Risk strikes Fast…
Chart is More Important than 1000 Words…
Most Important is Final Smart Money Reaction….
First..Monday H4 & EOD
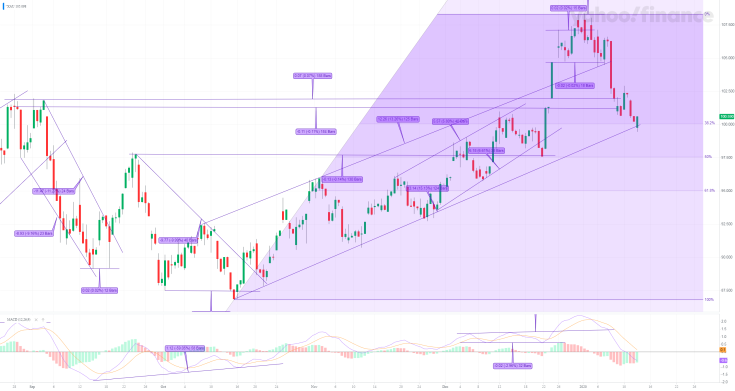
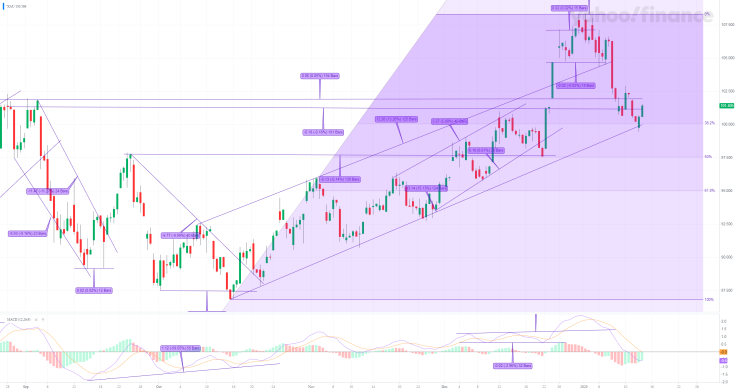
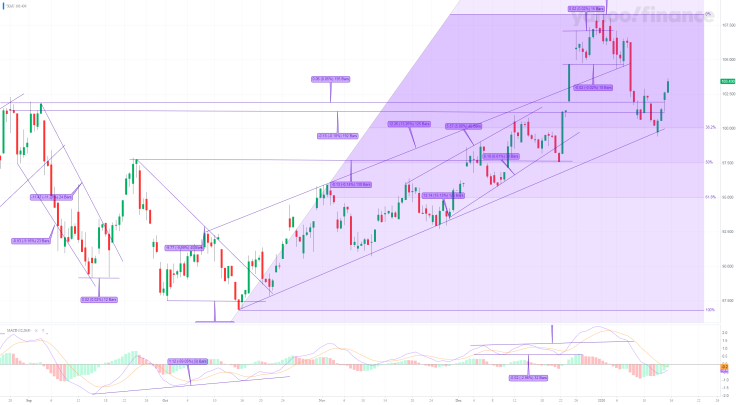
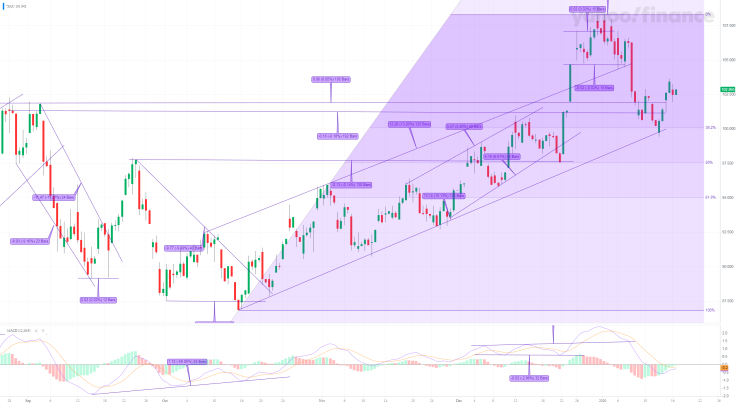
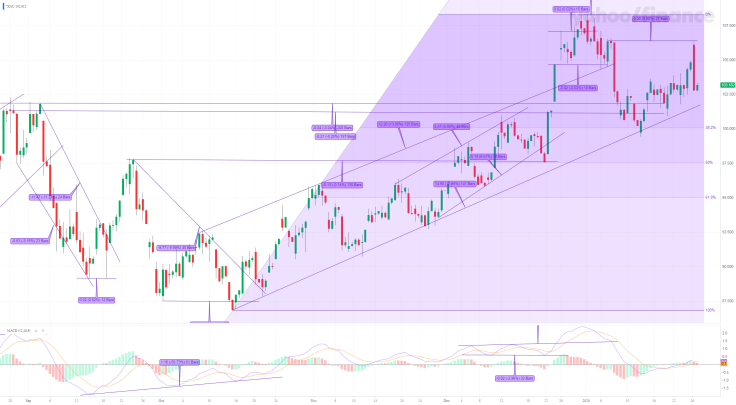
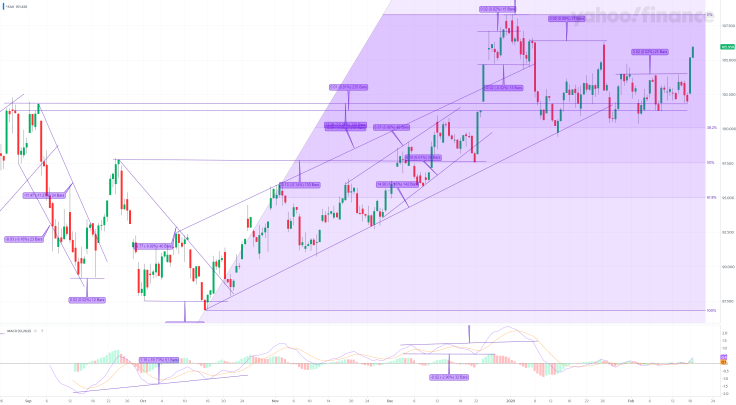
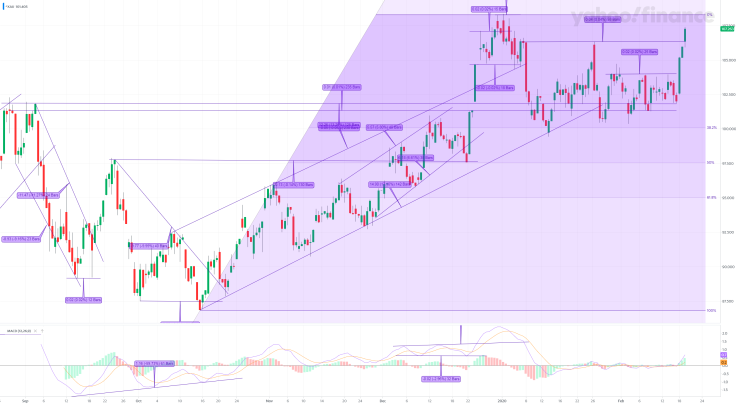
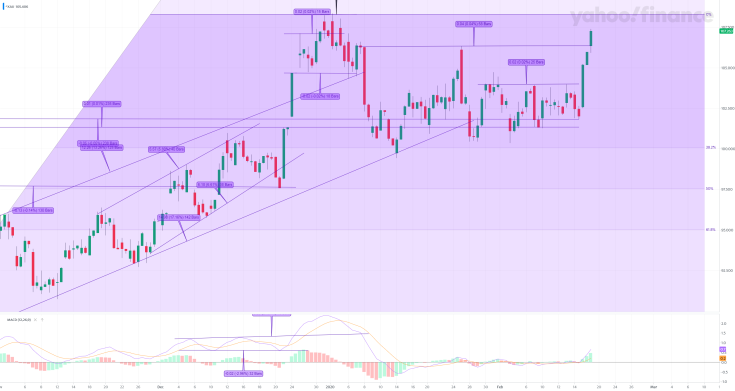
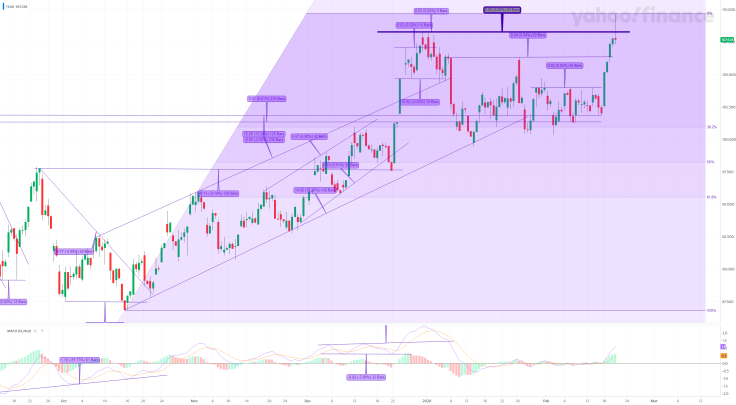
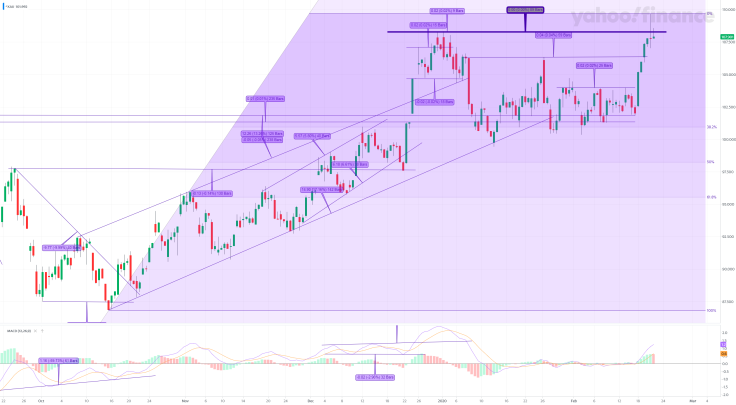
PHLX Gold/Silver Sector Index Intraday H4 Charts :
26.12.2019 – EOD
14.01.2020 – ( First Half US Session )
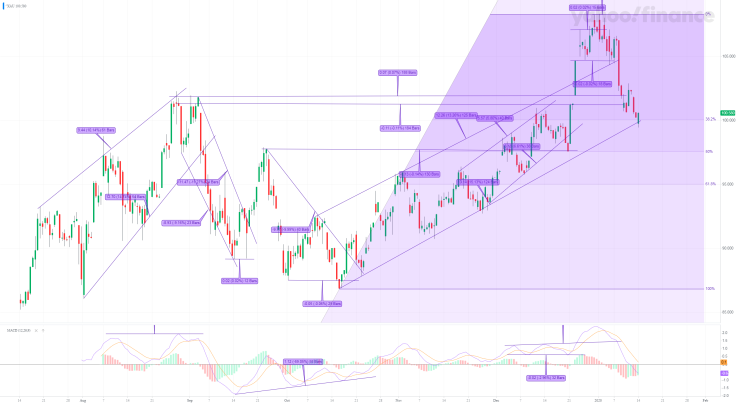
14.01.2020 – EOD
15.01.2020 – EOD
16.01.2020 – EOD
27.01.2020 – EOD
18.02.2020 – EOD
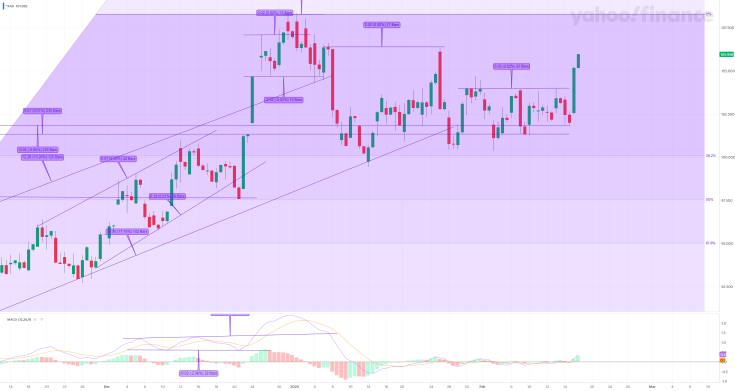
19.02.2020 – ( Second Half US Session )
20.02.2020 – ( Half US Session )
20.02.2020 – EOD
21.02.2020 – ( First Half US Session )
21.02.2020 – EOD
24.02.2020 – ( Second Half US Session )
24.02.2020 – EOD
25.02.2020 – EOD
26.02.2020 – EOD
28.02.2020 – EOD

